

The following table shows the five cities where the average U.S. house prices have increased the most
Question:
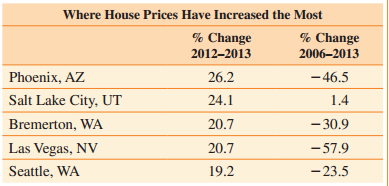
(a) If a house in Las Vegas, NV, cost $200,000 in 2012, how much did a similar house cost in 2013?
(b) If a house in Salt Lake City, UT, cost $220,000 in 2006, how much did a similar house cost in 2013?
(c) From 2006 to 2013, how much more did a $200,000 house in Bremerton, WA, decrease in price than a $200,000 house in Seattle, WA?
Fantastic news! We've Found the answer you've been seeking!
Step by Step Answer:
a 207 of 200000 0207 x 200 000 41400 200000 41400 241400 b 14 of 22000...View the full answer

Answered By
Umber Talat
I am providing full time mentoring and tutoring services in Business Finance, Contemporary issue in Global Economy, Quantitative Techniques, Principles of Marketing, strategic marketing, International Marketing, Organizational Behavior (OB), Consumer Behavior, Sales Force Management, Strategic Brand Management, Services Marketing, Integrated Marketing Communication (IMC), Principles of Management, General Management, Strategic Management, Small and Medium Enterprise Management, Innovation Management, Change Management, Knowledge Management, Strategic Planning, Operations Management, Supply Chain Management, Logistics Management, Inventory management, Total Quality Management (TQM), Productions Management, Project Management, Production Planning, Human Resource Management (HRM), Human Resource Development, Strategic HRM, Organizational Planning, Performance and Compensation Management, Recruitment and Selection, Organizational Development, Global Issues in Human Resource Management, Retail Marketing, Entrepreneurship, Entrepreneurial Marketing, International Business, Research Methods in Business, Business Communication, Business Ethics.
158+ Reviews
236+ Question Solved
Related Book For 

A Survey of Mathematics with Applications
ISBN: 978-0134112107
10th edition
Authors: Allen R. Angel, Christine D. Abbott, Dennis Runde
Question Posted:
