

The graph below shows the hours studied and the test grades on a biology test for 7
Question:
The grades on Biology Exam
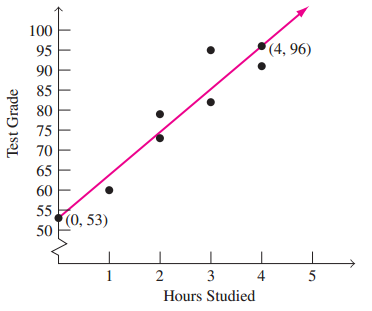
(a) Determine the slope of the red line using the two points indicated with ordered pairs.
(b) Using the slope determined in part (a) and the y-intercept, 10, 532, determine the equation of the red line.
(c) Using the equation you determined in part (b), determine the approximate test grade for a student who studied for 3 hours.
(d) Using the equation you determined in part (b), determine the amount of time a student would need to study to receive a grade of 80 on the biology test.
Fantastic news! We've Found the answer you've been seeking!
Step by Step Answer:
a m 96 534 0 434 1075 b ...View the full answer

Answered By
Bhartendu Goyal
Professional, Experienced, and Expert tutor who will provide speedy and to-the-point solutions. I have been teaching students for 5 years now in different subjects and it's truly been one of the most rewarding experiences of my life. I have also done one-to-one tutoring with 100+ students and help them achieve great subject knowledge. I have expertise in computer subjects like C++, C, Java, and Python programming and other computer Science related fields. Many of my student's parents message me that your lessons improved their children's grades and this is the best only thing you want as a tea...
2+ Reviews
10+ Question Solved
Related Book For 

A Survey of Mathematics with Applications
ISBN: 978-0134112107
10th edition
Authors: Allen R. Angel, Christine D. Abbott, Dennis Runde
Question Posted:
