

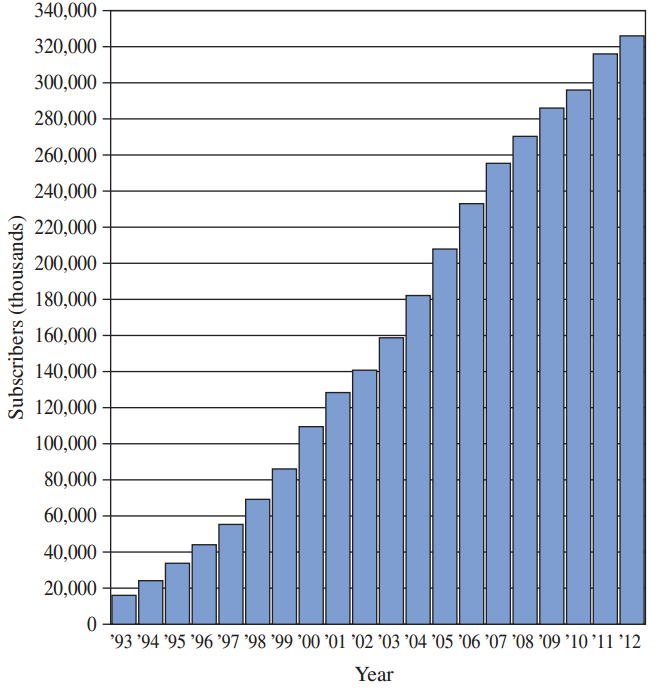
The graph below shows the number of U.S. cellular subscribers, in thou-sands, for the years 1993 through
Question:
(a) Does the graph approximate the graph of an exponential function?
(b) Estimate the number of U.S. cellular subscribers in 2012.
U.S. Cellular Telephone Subscribership
Fantastic news! We've Found the answer you've been seeking!
Step by Step Answer:
a No b ...View the full answer

Answered By
Elias Gichuru
am devoted to my work and dedicated in helping my clients accomplish their goals and objectives,providing the best for all tasks assigned to me as a freelancer,providing high quality work that yields high scores.promise to serve them earnestly and help them achieve their goals.i have the needed expertise,knowledge and experience to handle their tasks.
325+ Reviews
859+ Question Solved
Related Book For 

A Survey of Mathematics with Applications
ISBN: 978-0134112107
10th edition
Authors: Allen R. Angel, Christine D. Abbott, Dennis Runde
Question Posted:
