

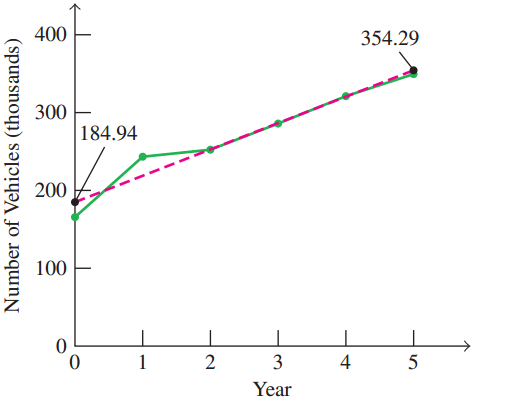
The green graph shows the number of recreational vehicles sold in the United States, in thousands, for
Question:
(a) Determine the slope of the red dashed line.
(b) Determine the equation of the red dashed line, using (0, 184.94) as the y-intercept.
(c) Using the equation you determined in part (b), estimate the number of recreational vehicles sold in the United States in 2012.
(d) Assuming the trend continues, use the equation you determined in part (b) to determine the year in which 533 thousand recreational vehicles will be sold in the United States.
Recreational Vehicles Sold in the Unites States
Fantastic news! We've Found the answer you've been seeking!
Step by Step Answer:
a Slope 35429 184945 0 169355 3387 b y ...View the full answer

Answered By
Nazrin Ziad
I am a post graduate in Zoology with specialization in Entomology.I also have a Bachelor degree in Education.I posess more than 10 years of teaching as well as tutoring experience.I have done a project on histopathological analysis on alcohol treated liver of Albino Mice.
I can deal with every field under Biology from basic to advanced level.I can also guide you for your project works related to biological subjects other than tutoring.You can also seek my help for cracking competitive exams with biology as one of the subjects.
2+ Reviews
10+ Question Solved
Related Book For 

A Survey of Mathematics with Applications
ISBN: 978-0134112107
10th edition
Authors: Allen R. Angel, Christine D. Abbott, Dennis Runde
Question Posted:
