

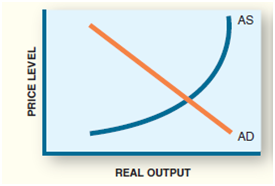
Illustrate on the following two graphs the impact of increased consumer confidence. What direction did (a) The
Question:
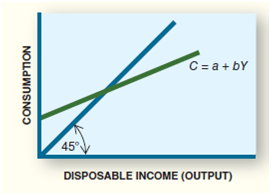
What direction did
(a) The consumption function shift?
(b) AD shift?
Fantastic news! We've Found the answer you've been seeking!
Step by Step Answer:
a upward b rightward Feedback An increase in consumer confidence impl...View the full answer

Answered By
Aun Ali
I am an Associate Member of Cost and Management Accountants of Pakistan with vast experience in the field of accounting and finance, including more than 17 years of teaching experience at university level. I have been teaching at both undergraduate and post graduate levels. My area of specialization is cost and management accounting but I have taught various subjects related to accounting and finance.
13+ Reviews
32+ Question Solved
Related Book For 

The Macro Economy Today
ISBN: 978-1259291821
14th edition
Authors: Bradley R. Schiller, Karen Gebhardt
Question Posted:
