

On the following graph, draw the AD and AS curves with these data: What is the equilibrium
Question:
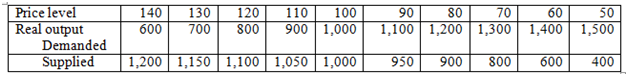
What is the equilibrium
(i) Real output level?
(ii) Price level?
Suppose net exports decline by $100 at all price levels, but all other components of aggregate demand remain constant.
(b) Draw the new AD curve.
(c) What is the new equilibrium
(i) Output level?
(ii) Price level?
(d) What macro problem has arisen in this economy: (A) unemployment or (B) inflation?
Fantastic news! We've Found the answer you've been seeking!
Step by Step Answer:
a i 1000 ii 100 b See the graph c i 975 ii 9250 d A une...View the full answer

Answered By
Utsab mitra
I have the expertise to deliver these subjects to college and higher-level students. The services would involve only solving assignments, homework help, and others.
I have experience in delivering these subjects for the last 6 years on a freelancing basis in different companies around the globe. I am CMA certified and CGMA UK. I have professional experience of 18 years in the industry involved in the manufacturing company and IT implementation experience of over 12 years.
I have delivered this help to students effortlessly, which is essential to give the students a good grade in their studies.
2+ Reviews
10+ Question Solved
Related Book For 

The Macro Economy Today
ISBN: 978-1259291821
14th edition
Authors: Bradley R. Schiller, Karen Gebhardt
Question Posted:
