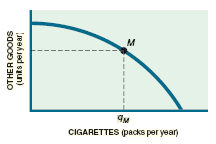
Use Figure 4.3 to illustrate on the accompanying production possibilities curve the optimal mix of output (X).
Question:
Does the optimal mix include (A) more or (B) fewer €œother goods€?

Transcribed Image Text:
Ям CIGARETTES (packs per year) OTHER GOODS (unts peryear
Fantastic news! We've Found the answer you've been seeking!
Step by Step Answer:
Answer rating: 57% (7 reviews)
The optimal mix includes A more other goods Feedback Remember that the market ...View the full answer

Answered By

Supriya agarwal
Professional tutor , self employed with teaching experience of various subjects like Statistics, marketing , maths to a batch of 50 students at one time with the 100% results.
0.00
0 Reviews
10+ Question Solved
Related Book For 

The Macro Economy Today
ISBN: 978-1259291821
14th edition
Authors: Bradley R. Schiller, Karen Gebhardt
Question Posted:
Students also viewed these Business questions
-
True or False: 1. Consumer sovereignty describes how individual consumers in market economies determine what is to be produced. 2. Command economies rely on central planning, where decisions about...
-
True or False: 1. Underutilized resources or those not being put to their best uses are illustrated by output combinations along the production possibilities curve. 2. We all have an interest in the...
-
Use the accompanying diagram to answer questions a and b. a. On the exhibit provided, illustrate the short-run effects of an increase in aggregate demand. What happens to the price level, real...
-
Consider the real projective n-space RP" obtained by identifying each point S" with its antipode -r. (a) Compute its fundamental group. (b) Find all its covering spaces up to isomorphism.
-
Then describe the implications for his effectiveness as the CEO of Facebook in terms of each CSE element.
-
You attach one end of a string of length \(\ell\) to a small ball of inertia \(m\). You attach the string's other end to a pivot that allows free revolution. You hold the ball out to the side with...
-
Consider the three models a. \(y=\beta_{0}+\beta_{1}(1 / x)+\varepsilon\) b. \(1 / y=\beta_{0}+\beta_{1} x+\varepsilon\) c. \(y=x /\left(\beta_{0}-\beta_{1} x ight)+\varepsilon\) All of these models...
-
Speier Company estimates that 240,000 direct labor hours will be worked during 2012 in the Assembly Department. On this basis, the following budgeted manufacturing overhead data are computed. It is...
-
An aluminum wheel rubs against an aluminum plate in such a manner that there is a 51.0 N force of kinetic friction between them, and the relative speed at which the two surfaces slide over each other...
-
What is the oxidation state change for chlorine in the following reaction 16 H+ + 2 MnO4 + 10 CI 5 Cl + 2 Mn+ + 8 HO - Select one: O a. from +7 to +2 O b. From -1 to 0 O c. from -10 to 0 O d. from 1...
-
The Florida Department of Corrections publishes an online death row fact sheet. It reports the average time on death row prior to execution as 11.72 years but provides no standard deviation. This...
-
Consider the following budgeted data for the client case of Thanh Ngs accounting firm. The client wants a fixed-price quotation. Direct professional labour................................... $20,000...
-
Kyoto Manufacturing produces automobile mufflers, which are then sent to the United States where they are installed in domestically built cars. Truck Inc., a U.S. auto company, received a shipment of...
-
Fertility rates vary widely among various ethnic groups in the United States. Black and Spanish-speaking Americans have above-average rates, for example, while Jews have below-average fertility...
-
In thinking about the appropriate balance between the market and the government in achieving sustainability, do you think the government needs to take a stronger role or would you favor reducing...
-
Trade simply represents economic imperialism where one country exploits another. The environment is the inevitable victim. Discuss.
-
The microeconomic theory of fertility provides an opportunity to determine how public policies that were designed for quite different purposes could affect fertility rates. Identify some public...
-
How should the public sector handle a toxic gas, such as radon, that occurs naturally and seeps into some houses through the basement or the water supply? Is this a case of an externality? Does the...
-
In problem, use transformations to graph each function. Determine the domain, range, and horizontal asymptote of each function. f(x) = 3 x 2
-
we have to compute the letter grades for a course. The data is a collection of student records stored in a file. Each record consists of a name(up to 20 characters), ID (8 characters), the scores of...
-
Why is interest expense disallowed if it is incurred to purchase or hold tax-exempt obligations?
-
Since its inception in 1971, Hard Rock has grown from a modest London pub to a global power managing 145 cafes, 21 hotels, 10 casinos, live music venues, and a huge annual Rockfest concert. This puts...
-
Frito-Lay, the massive Dallas, Texas-based subsidiary of PepsiCo, has 38 plants and 48 000 employees in North America. Seven of Frito-Lay's 41 brands exceed $1 billion in sales: Fritos, Lay's...
-
Sell of Process Further Rose Hill, a soybean farm in northern Minnesota, has a herd of 50 dairy cows. The cows produce approximately 2,800 gallons of milk per week. The farm currently sells all its...
-
The 3 promotional methods to use will include digital marketing, word to mouth and branding. D g. Part 4: Promotional Strategy i. Identify a promotional mix consisting of at least three promotional...
-
Wu Inc. Statement of Income Year Ended August 31, 2024 Service revenue Operating expenses Income before income tax Income tax expense Net income Wu Inc. $ 325,000 [1] 116,000 23,000 $ [2] Statement...

Study smarter with the SolutionInn App


