

Use the following data to draw supply and demand curves on the accompanying graph. (a) What is
Question:
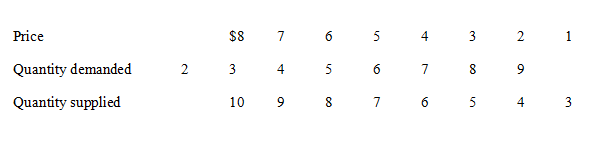
(a) What is the equilibrium price?
(b) If a minimum price (price floor) of $6 is set,
(i) What kind of disequilibrium situation results?
(ii) How large is it?
(c) If a maximum price (price ceiling) of $3 is set,
(i) What kind of disequilibrium situation results?
(ii) How large is it?
Illustrate these answers.
Fantastic news! We've Found the answer you've been seeking!
Step by Step Answer:
a 4 b i Surplus ii 4 units c i Shortage ii 2 units Feedback a Quantity demanded 6 is equal to quanti...View the full answer

Answered By
PALASH JHANWAR
I am a Chartered Accountant with AIR 45 in CA - IPCC. I am a Merit Holder ( B.Com ). The following is my educational details.
PLEASE ACCESS MY RESUME FROM THE FOLLOWING LINK: https://drive.google.com/file/d/1hYR1uch-ff6MRC_cDB07K6VqY9kQ3SFL/view?usp=sharing
3+ Reviews
10+ Question Solved
Related Book For 

The Macro Economy Today
ISBN: 978-1259291821
14th edition
Authors: Bradley R. Schiller, Karen Gebhardt
Question Posted:
