

The statement of financial position and statement of income for High Liner Foods Incorporated are in Exhibits
Question:
The statement of financial position and statement of income for High Liner Foods Incorporated are in Exhibits 12.11A and 12.11B. The statement of financial position and statement of earnings and losses for Clearwater Seafoods Incorporated are in Exhibits 12.11C and 12.11D. In Canada, High Liner Foods and Clearwater Seafoods are both in the seafood industry. Both companies harvest, process, and distribute seafood. Clearwater concentrates on shellfish such as lobster, scallops, clams, coldwater shrimp, and crab, whereas High Liner Foods has a broader product line and includes various species of fish as well as shellfish. EXHIBIT 12.11A High Liner Foods Incorporated’s 2016 Consolidated Statement of Financial Position
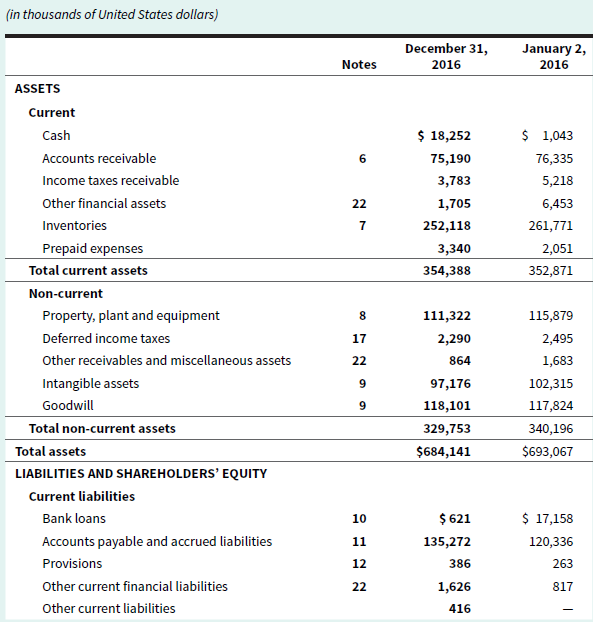
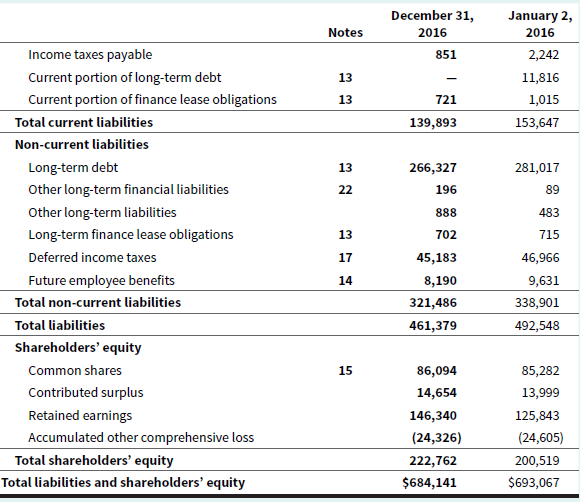
EXHIBIT 12.11B High Liner Foods Incorporated’s 2016 Consolidated Statement of Income
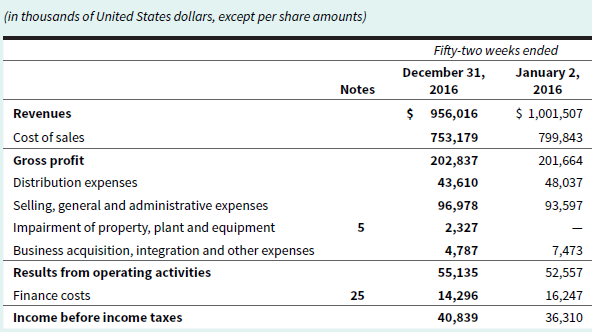
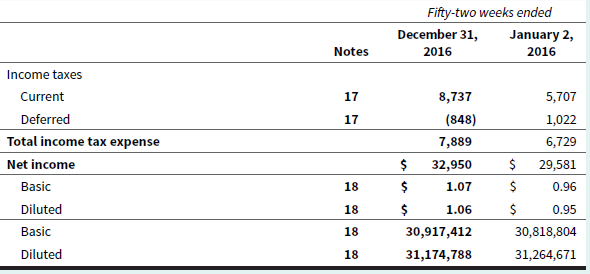
EXHIBIT 12.11C Clearwater Seafoods Incorporated’s 2016 Consolidated Statement of Financial Position
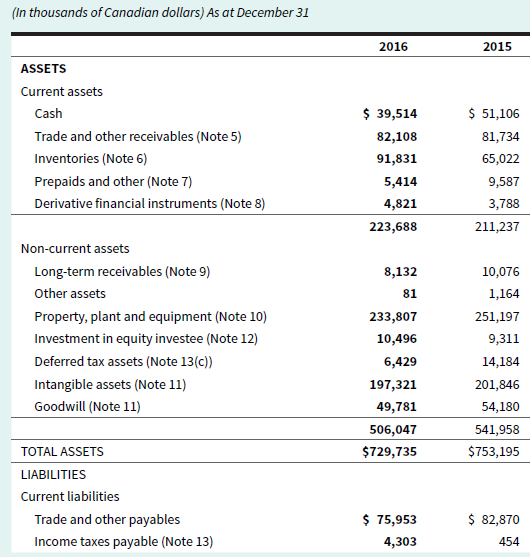
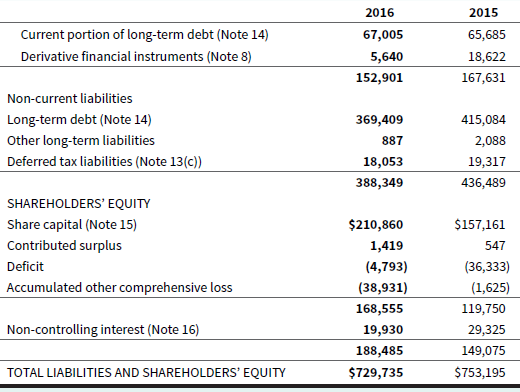
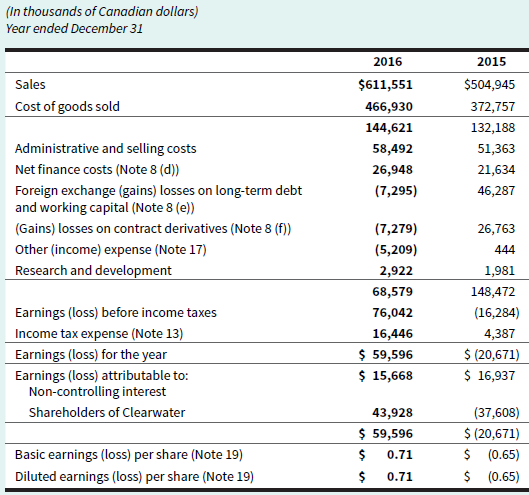
EXHIBIT 12.11D Clearwater Seafoods Incorporated’s 2016 Consolidated Statement of Earnings (Loss)
Required
Use the financial statements for High Liner Foods and Clearwater Seafoods to answer the following questions:
a. Prepare a common-size analysis of the statements of income (loss) for the two companies for both years. Why do you think the profit margins are so diff erent for the two companies? In which areas
does High Liner Foods seem to have an advantage? In which areas does Clearwater Seafoods have an advantage?
b. Compare the current and quick ratios for the two companies. Which company is more liquid? Are you surprised by the large difference between the current ratio and the quick ratio for the companies? Why or why not?
c. Compare the inventory turnover of the two companies.
Financial StatementsFinancial statements are the standardized formats to present the financial information related to a business or an organization for its users. Financial statements contain the historical information as well as current period’s financial...
Step by Step Answer:
a Common size Statements of Earnings Loss High Liner Foods Clearwater Seafood 2016 2015 2016 2015 Sales 1000 1000 1000 1000 Cost of sales 788 799 764 ...View the full answer


Understanding Financial Accounting
ISBN: 9781119406921
2nd Canadian Edition
Authors: Christopher D. Burnley
