

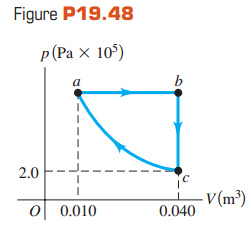
The graph in Fig. P19.48 shows a pV-diagram for 3.25 moles of ideal helium (He) gas. Part
Question:
(a) Find the pressure of the He at point a.
(b) Find the temperature of the He at points a, b, and c.
(c) How much heat entered or left the He during segments ab,bc, andca? In each segment, did the heat enter or leave?
(d) By how much did the internal energy of the He change from a to b, from b to c, and from c to a? Indicate whether this energy increased or decreased.
Fantastic news! We've Found the answer you've been seeking!
Step by Step Answer:
Identify Segment ab is isobaric bc is isochoric and ca is isotherm...View the full answer

Answered By
Ashok Kumar Malhotra
Chartered Accountant - Accounting and Management Accounting for 15 years.
QuickBooks Online - Certified ProAdvisor (Advance - QuickBooks Online for 3 years.
3+ Reviews
10+ Question Solved
Related Book For 
University Physics with Modern Physics
ISBN: 978-0321696861
13th edition
Authors: Hugh D. Young, Roger A. Freedman, A. Lewis Ford
Question Posted:
