

Suppose that the graph below shows measured values of hc for air in forced convection over a
Question:
Suppose that the graph below shows measured values of hc for air in forced convection over a cylinder of diameter D plotted on a logarithmic graph of Nud as a function of RedPr.
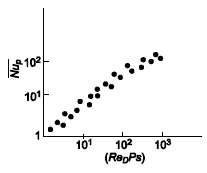
Write an appropriate dimensionless correlation for the average Nusselt number for these data and state any limitations to your equation.GIVENForced convection of air over a cylinderExperimental data given above
Fantastic news! We've Found the answer you've been seeking!
Step by Step Answer:
The data lies along an approximately straight line on ...View the full answer

Answered By
Bhartendu Goyal
Professional, Experienced, and Expert tutor who will provide speedy and to-the-point solutions. I have been teaching students for 5 years now in different subjects and it's truly been one of the most rewarding experiences of my life. I have also done one-to-one tutoring with 100+ students and help them achieve great subject knowledge. I have expertise in computer subjects like C++, C, Java, and Python programming and other computer Science related fields. Many of my student's parents message me that your lessons improved their children's grades and this is the best only thing you want as a tea...
2+ Reviews
10+ Question Solved
Related Book For 

Principles of heat transfer
ISBN: 978-0495667704
7th Edition
Authors: Frank Kreith, Raj M. Manglik, Mark S. Bohn
Question Posted:
