

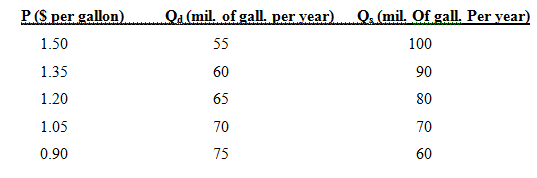
Suppose that the supply and demand schedules for orange juice in the United States for 2005 is
Question:
Suppose that the supply and demand schedules for orange juice in the United States for 2005 is given in the following table:
a) Using this information, what is the equation for the demand curve for orange juice?
b) What is the equation for the supply curve for orange juice?
c) Using your answers from parts (a) and (b), what is the equilibrium price and quantity of orange juice?
d) The FDA comes out with a report on orange juice that reduces tastes and causes the Qd to be 5mil gall per year lower at each price. After this report comes out, what is the new equilibrium price and quantity of orange juice?
Fantastic news! We've Found the answer you've been seeking!
Step by Step Answer:
a Take any 2 points 15 55 and 135 60 Use these to get li...View the full answer

Answered By
Benish Ahmad
I'm a professional software engineer. I'm lectutrer at GCUF and I have 3 years of teaching experience. I'm looking forward to getting mostly computer science work including:
Programming fundamentals
Object oriented programming
Data structures
object oriented design and analysis
Database system
Computer networks
Discrete mathematics
Web application
I am expert in different computer languages such as C++, java, JavaScript, Sql, CSS, Python and C#. I'm also have excellent knowledge of essay writing and research. I have worked in other Freelancing website such as Fiverr and Upwork. Now I have finally decided to join the SolutionInn platform to continue with my explicit work of helping dear clients and students to achieve their academic dreams. I deliver plagiarism free work and exceptional projects on time. I am capable of working under high pressure.
2+ Reviews
10+ Question Solved
Related Book For 

Question Posted:
