

The figure shows spectra of 1.0010 -4 M MnO - 4 , 1.0010 -4 M Cr 2
Question:
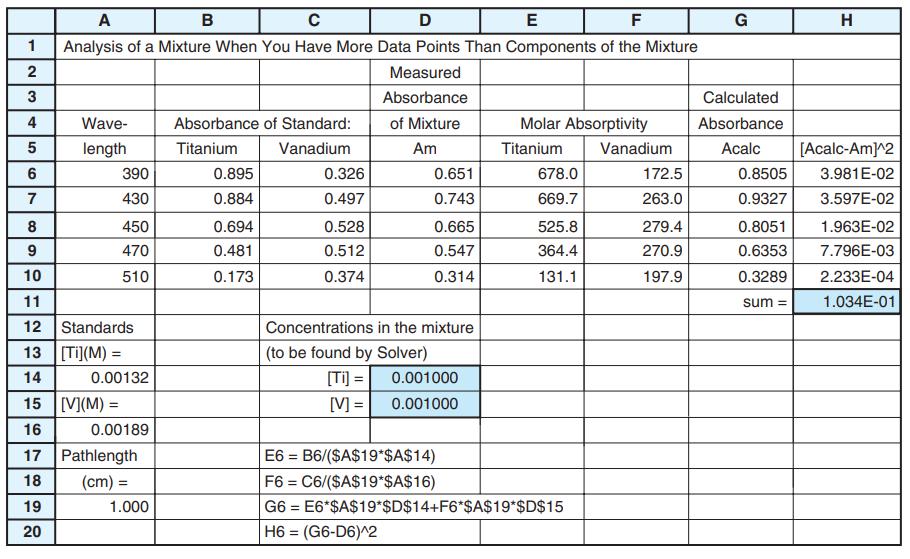
The figure shows spectra of 1.00×10⁻⁴ M MnO-4, 1.00×10⁻⁴ M Cr2O72-, and an unknown mixture of both, all in 1.000-cm-pathlength cells. Absorbances are given in the table. Use the least-squares procedure in Figure 18-3 to find the concentration of each species in the mixture.
-1.png)
-2.png)
Figure 18-3
Fantastic news! We've Found the answer you've been seeking!
Step by Step Answer:
1 2 3 4 Wave 5 length 56 7 8 69 A B D E F G Analysis of a Mixture When ...View the full answer

Answered By
Mamba Dedan
I am a computer scientist specializing in database management, OS, networking, and software development. I have a knack for database work, Operating systems, networking, and programming, I can give you the best solution on this without any hesitation. I have a knack in software development with key skills in UML diagrams, storyboarding, code development, software testing and implementation on several platforms.
56+ Reviews
137+ Question Solved
Related Book For 

Question Posted:
