

The following data represent the number of home runs Hank Aaron hit each year during his 23year
Question:
The following data represent the number of home runs Hank Aaron hit each year during his 23year baseball career.
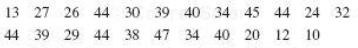
a. Calculate the mean and standard deviation of these data.
b. Group these data into four classes with class boundaries of 10 to under 20, 20 to under 30, 30 to under 40, and 40 to under 50.
c. Calculate the approximate mean and standard deviation of these grouped data.
d. Explain the difference in the results of part c from those of part a.
Fantastic news! We've Found the answer you've been seeking!
Step by Step Answer:
d The mean and standard deviations of the grouped data assume that all the values within each group ...View the full answer

Answered By
Saud Ur Rehman
Evaluating manufacturing processes by designing and conducting research programs; applying knowledge of product design, fabrication, assembly, tooling, and materials; conferring with equipment vendors; soliciting observations from operators. Developing manufacturing processes by studying product requirements; researching, designing, modifying, and testing manufacturing methods and equipment; conferring with equipment vendors. Keeping equipment operational by coordinating maintenance and repair services; following manufacturer's instructions and established procedures; requesting special service.
1+ Reviews
10+ Question Solved
Related Book For 

Question Posted:
