

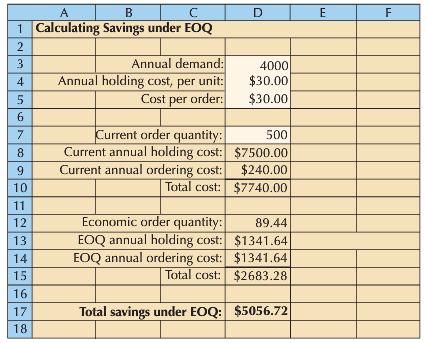
The following figure shows an Excel spreadsheet that compares total ordering and holding costs for some current
Question:
Fantastic news! We've Found the answer you've been seeking!
Step by Step Answer:
tr msoheightsourceauto col msowidthsourceauto br msodataplacementsamecell style0 msonumberformatGeneral textaligngeneral verticalalignbottom whitespac...View the full answer

Answered By
Pushpinder Singh
Currently, I am PhD scholar with Indian Statistical problem, working in applied statistics and real life data problems. I have done several projects in Statistics especially Time Series data analysis, Regression Techniques.
I am Master in Statistics from Indian Institute of Technology, Kanpur.
I have been teaching students for various University entrance exams and passing grades in Graduation and Post-Graduation.I have expertise in solving problems in Statistics for more than 2 years now.I am a subject expert in Statistics with Assignmentpedia.com.
3+ Reviews
10+ Question Solved
Related Book For 
Introduction to Operations and Supply Chain Management
ISBN: 978-0132747325
3rd edition
Authors: Cecil B. Bozarth, Robert B. Handfield
Question Posted:
