

The following graph setups depict the dollar amount of fixed cost on the vertical axes and the
Question:
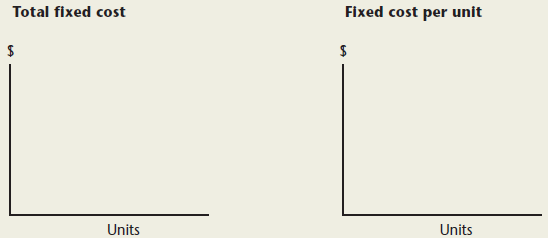
The following graph setups depict the dollar amount of fixed cost on the vertical axes and the level of activity on the horizontal axes:
Required
a. Draw a line that depicts the relationship between total fixed cost and the level of activity.
b. Draw a line that depicts the relationship between fixed cost per unit and the level of activity.
Fantastic news! We've Found the answer you've been seeking!
Step by Step Answer:
a b S...View the full answer

Answered By
Muhammad Ahtsham Shabbir
I am a professional freelance writer with more than 7 years’ experience in academic writing. I have a Bachelor`s Degree in Commerce and Master's Degree in Computer Science. I can provide my services in various subjects.
I have professional excellent skills in Microsoft ® Office packages such as Microsoft ® Word, Microsoft ® Excel, and Microsoft ® PowerPoint. Moreover, I have excellent research skills and outstanding analytical and critical thinking skills; a combination that I apply in every paper I handle.
I am conversant with the various citation styles, among them; APA, MLA, Chicago, Havard, and AMA. I also strive to deliver the best to my clients and in a timely manner.My work is always 100% original. I honestly understand the concern of plagiarism and its consequences. As such, I ensure that I check the assignment for any plagiarism before submission.
392+ Reviews
587+ Question Solved
Related Book For 

Fundamental Managerial Accounting Concepts
ISBN: 978-0078110894
6th Edition
Authors: Edmonds, Tsay, olds
Question Posted:
