

The heart rates (in beats per minute) and QT intervals (in milliseconds) for 13 males (the figure
Question:
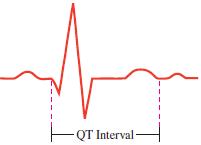
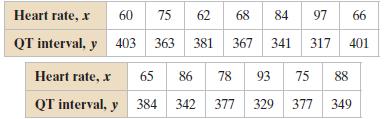
The heart rates (in beats per minute) and QT intervals (in milliseconds) for 13 males (the figure given below shows the QT interval of a heartbeat in an electrocardiogram)
Electrocardiogram
(a) x = 120 beats per minute
(b) x = 67 beats per minute
(c) x = 90 beats per minute
(d) x = 83 beats per minute
Find the equation of the regression line for the data. Then construct a scatter plot of the data and draw the regression line. (Each pair of variables has a significant correlation.) Then use the regression equation to predict the value of y for each of the x-values, if meaningful. If the x-value is not meaningful to predict the value of y, explain why not. If convenient, use technology.
Step by Step Answer:
a It is not meaningful to predict the value of y for x 120 because x 120 i...View the full answer


Elementary Statistics Picturing The World
ISBN: 9780321911216
6th Edition
Authors: Ron Larson, Betsy Farber
