

The volatility of a stock is often measured by its beta value. You can estimate the beta
Question:
The volatility of a stock is often measured by its beta value. You can estimate the beta value of a stock by developing a simple linear regression model, using the percentage weekly change in the stock as the dependent variable and the percentage weekly change in a market index as the independent variable. The S& P 500 Index is a common index to use. For example, if you wanted to estimate the beta value for Disney, you could use the following model, which is sometimes referred to as a market model:
1% weekly change in Disney2 = β0
+ β1(% weekly change in S & p 500 index) + ε
The least squares regression estimate of the slope b1 is the estimate of the beta value for Disney. A stock with a beta value of 1.0 tends to move the same as the overall market. A stock with a beta value of 1.5 tends to move 50% more than the overall market, and a stock with a beta value of 0.6 tends to move only 60% as much as the overall market. Stocks with negative beta values tend to move in the opposite direction of the overall market. The following table gives some beta values for some widely held stocks as of June 8, 2014:
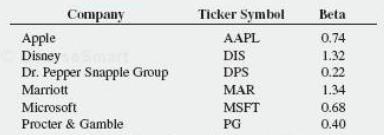
a. For each of the six companies, interpret the beta value.
b. How can investors use the beta value as a guide for investing?
StocksStocks or shares are generally equity instruments that provide the largest source of raising funds in any public or private listed company's. The instruments are issued on a stock exchange from where a large number of general public who are willing...
Step by Step Answer:
a Apples stock moves 74 as much as the overall market and is considered les...View the full answer


Business Statistics A First Course
ISBN: 9780321979018
7th Edition
Authors: David M. Levine, Kathryn A. Szabat, David F. Stephan
