

Use the results of Exercises 1.28 and 1.29 to create a plot that illustrates the interaction evident
Question:
Use the results of Exercises 1.28 and 1.29 to create a plot that illustrates the interaction evident from the data. Use the plot in Figure in Example 1.3 as a guide. Could the type of information found in Exercises 1.28, 1.29, and 1.30 have been found in an observational study in which there was no control on injection velocity and mold temperature by the analyst? Explain why or whynot.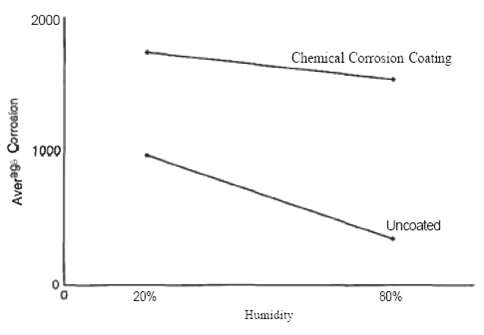
Fantastic news! We've Found the answer you've been seeking!
Step by Step Answer:
An interaction plot is shown next It is quite obvious to find the interaction between the two va...View the full answer

Answered By
Carly Cimino
As a tutor, my focus is to help communicate and break down difficult concepts in a way that allows students greater accessibility and comprehension to their course material. I love helping others develop a sense of personal confidence and curiosity, and I'm looking forward to the chance to interact and work with you professionally and better your academic grades.
12+ Reviews
21+ Question Solved
Related Book For 
Probability & Statistics For Engineers & Scientists
ISBN: 9780130415295
7th Edition
Authors: Ronald E. Walpole, Raymond H. Myers, Sharon L. Myers, Keying
Question Posted:
