

Consider the situation of Exercise 1.28. But now use the following data set in which shrinkage is
Question:
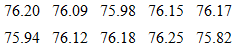
Consider the situation of Exercise 1.28. But now use the following data set in which shrinkage is measured once again at low injection velocity and high injection velocity. However, this time the mold temperature is raised to a "high" level and held constant. Shrinkage values at low injection velocity:
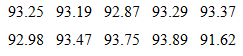
Shrinkage values at high injection velocity:
(a) As in Exercise 1.28, construct a dot plot with both data sets on the same graph and identify both means (i.e., mean shrinkage for low injection velocity and for high injection velocity).
(b) As in Exercise 1.28, comment on the influence of injection velocity on shrinkage for high mold temperature. Take into account the position of the two means and the variability around each mean.
(c) Compare your conclusion in (b) with that in (b) of Exercise 1.28 in which mold temperature was held at a low level. Would you say that there is an interaction between injection velocity and mold temperature? Explain.
Step by Step Answer:
a A dot plot is shown next Low 76 79 In the figure x repr...View the full answer


Probability & Statistics For Engineers & Scientists
ISBN: 9780130415295
7th Edition
Authors: Ronald E. Walpole, Raymond H. Myers, Sharon L. Myers, Keying
