

Figure shows the block diagram of a beterodyne spectrum analyzer. It consists of a variable-frequency oscillator, multiplier,
Question:
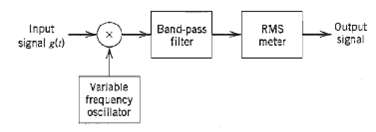
Figure shows the block diagram of a beterodyne spectrum analyzer. It consists of a variable-frequency oscillator, multiplier, band-pass filter, and root mean square (RMS) meter. The oscillator has amplitude A and square over the range ?0 to ?0 + W, where ?0 is the mid-band frequency of the filter and W is the signal bandwidth. Assume that ?0 = 2W, the filter bandwidth ?? is small compared with ?0 and that the pass-band magnitude response of the filter is one. Determine the value of the RMS meter output for a low-pass input signal g (t).
Fantastic news! We've Found the answer you've been seeking!
Step by Step Answer:
Let st denote the multiplier out put as shown by st A gt cos2nf t where f lies in the rang...View the full answer

Answered By
SYED HARIS ALI RIZVI
I want to become a successful civil servant and acquired a top bureaucracy,it is very much moment of proud for me to say that I am gave tuition to different classes since last 3 years.
0 Reviews
10+ Question Solved
Related Book For 

Question Posted:
