

Five companies make up the steel industry in the US. Last years sales for each of the
Question:
Five companies make up the steel industry in the US. Last year’s sales for each of the companies (in $millions) are shown below:
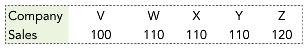
a. Show all 10 equally likely samples of size three that could be selected from this company population.
b. Calculate the mean sales for each of the 10 samples.
c. Produce a table showing the relative frequency distribution for these sample means and draw the corresponding bar chart.
d. According to the distribution you produced in part c, if you were to choose a simple random sample of size three from the company population, how likely is it that the mean sales for the sample would be $110 million? How likely is it that the mean would be $110 million or more?
Distribution
The word "distribution" has several meanings in the financial world, most of them pertaining to the payment of assets from a fund, account, or individual security to an investor or beneficiary. Retirement account distributions are among the most...
Fantastic news! We've Found the answer you've been seeking!
Step by Step Answer:
a and b The 10 samples together with the sample means are Sample Sample VWX 10667 ...View the full answer

Answered By
Rishabh Ojha
During my undergraduate i used to participate as TA (Teaching Assistant) in several electronics and computers subject. I'm passionate about learning Computer Science as my bachelors are in Electronics but i learnt most of the Computer Science subjects on my own which Machine Learning also. At Present, i'm a working professional pursuing my career as a Machine Learning Engineer and i want to help others learn during my free hours, that's all the motivation behind giving tuition. To be frank i have no prior experience of tutoring but i have solved problems on opensource platforms like StackOverflow and github. ~Thanks
3+ Reviews
10+ Question Solved
Related Book For 

Understanding Business Statistics
ISBN: 978-1118145258
1st edition
Authors: Stacey Jones, Tim Bergquist, Ned Freed
Question Posted:
