

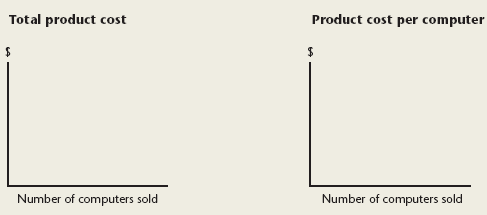
Graphing variable cost behavior Dubovsky Computers purchases computers from a manufacturer for $500 per computer. The following
Question:
Graphing variable cost behavior Dubovsky Computers purchases computers from a manufacturer for $500 per computer. The following graph setups depict product cost on the vertical axes and activity level on the horizontal axes:
.:.
Required
a. Draw a line that depicts the relationship between total product cost and the number of computers sold.
b. Draw a line that depicts the relationship between cost per computer and the number of computers sold.
Fantastic news! We've Found the answer you've been seeking!
Step by Step Answer:
a Total produc...View the full answer

Answered By
Somshukla Chakraborty
I have a teaching experience of more than 4 years by now in diverse subjects like History,Geography,Political Science,Sociology,Business Enterprise,Economics,Environmental Management etc.I teach students from classes 9-12 and undergraduate students.I boards I handle are IB,IGCSE, state boards,ICSE, CBSE.I am passionate about teaching.Full satisfaction of the students is my main goal.
I have completed my graduation and master's in history from Jadavpur University Kolkata,India in 2012 and I have completed my B.Ed from the same University in 2013. I have taught in a reputed school of Kolkata (subjects-History,Geography,Civics,Political Science) from 2014-2016.I worked as a guest lecturer of history in a college of Kolkata for 2 years teaching students of 1st ,2nd and 3rd year. I taught Ancient and Modern Indian history there.I have taught in another school in Mohali,Punjab teaching students from classes 9-12.Presently I am working as an online tutor with concept tutors,Bangalore,India(Carve Niche Pvt.Ltd.) for the last 1year and also have been appointed as an online history tutor by Course Hero(California,U.S) and Vidyalai.com(Chennai,India).
2+ Reviews
10+ Question Solved
Related Book For 

Fundamental Managerial Accounting Concepts
ISBN: 978-0078110894
6th Edition
Authors: Edmonds, Tsay, olds
Question Posted:
