

In the book Tools and Methods for the Improvement of Quality, Gitlow, Gitlow, Oppenheim, and Oppenheim discuss
Question:
In the book Tools and Methods for the Improvement of Quality, Gitlow, Gitlow, Oppenheim, and Oppenheim discuss an example of using x̅ and R charts to study tuning knob diameters. In their problem description the authors say this:
A manufacturer of high-end audio components buys metal tuning knobs to be used in the assembly of its products. The knobs are produced automatically by a subcontractor using a single machine that is supposed to produce them with a constant diameter. Nevertheless, because of persistent final assembly problems with the knobs, management has decided to examine this process output by requesting that the subcontractor keep an .v-bar and R chart for knob diameter.
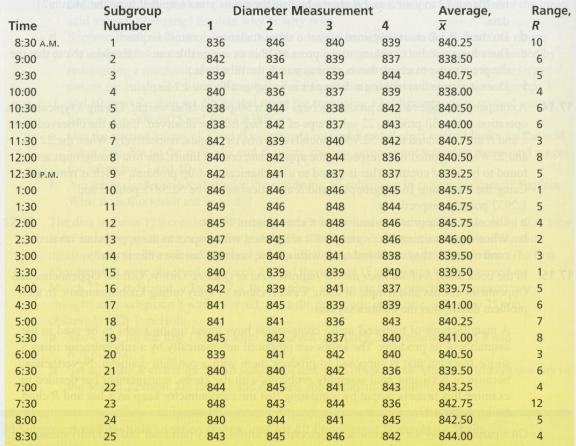
On a particular day the subcontractor selects four knobs every half hour and carefully measures their diameters. Twenty-five subgroups are obtained, and these subgroups (along with their subgroup means and ranges) are given in Table 17.10.
a. For these data show that x̅̅ = 841.45 and = 5.16. Then use these values to calculate control limits and to set up and R charts for the 25 subgroups of tuning knob diameters. Do these x and R charts indicate the existence of any assignable causes? Explain.
b. An investigation is carried out to find out what caused the large range for subgroup 23. The investigation reveals that a water pipe burst at 7:25 P.M. and that the mishap resulted in water leaking under the machinery used in the tuning knob production process. The resulting disruption is the apparent cause for the out-of-control range for subgroup 23. The water pipe is mended, and since this fix is reasonably permanent, we are justified in removing subgroup 23 from the data set. Using the remaining 24 subgroups, show that revised center lines are x̅̅ = 841.40 and R̅ = 4.88.
c. Use the revised values of x and R to set up revised x̅̅ and charts for the remaining 24 subgroups of diameters. Be sure to omit the mean and range for subgroup 23.
d. Looking at the revised R chart, is this chart now in statistical control? What does your answer say about whether we can use the x chart to decide if the process mean is changing?
e. Looking at the revised x̅ chart, is this chart in statistical control? What does your answer tell us about the process mean?
f. An investigation is now undertaken to find the cause of the very high x̅ values for subgroups 10, 11, 12, and 13. We again quote Gitlow, Gitlow, Oppenheim, and Oppenheim:
The investigation leads to the discovery that ... a keyway wedge had cracked and needed to be replaced on the machine. The mechanic who normally makes this repair was out to lunch, so the machine operator made the repair. This individual had not been properly trained for the repair: for this reason, the wedge was not properly aligned in the keyway, and the subsequent points were out of control. Both the operator and the mechanic agree that the need for this repair was not unusual. To correct this problem it is decided to train the machine operator and provide the appropriate tools for making this repair in the mechanic's absence. Furthermore, the maintenance and engineering staffs agree to search for a replacement part for the wedge that will not be so prone to cracking.
Since the assignable causes responsible for the very high x̅ values for subgroups 10, 11, 12, and 13 have been found and eliminated, we remove these subgroups from the data set. Show that removing subgroups 10, II, 12, and 13 (in addition to the previously removed
TABLE 17.10
25 Subgroups of Tuning Knob Diameters
subgroup 23) results in the revised center lines x̅̅ = 840.46 and = 5.25. Then use these revised values to set up revised and R charts for the remaining 20 subgroups,
g. Are all of the subgroup means and ranges for these newly revised x and R charts inside their respective control limits?
Step by Step Answer:
a b J d e f Means Ranges Means X 840 2584400 25 Ranges ...View the full answer


Business Statistics In Practice
ISBN: 9780073401836
6th Edition
Authors: Bruce Bowerman, Richard O'Connell
