

The following data represent the median household income (in dollars) for the 50 states and the District
Question:
The following data represent the median household income (in dollars) for the 50 states and the District of Columbia in 2017.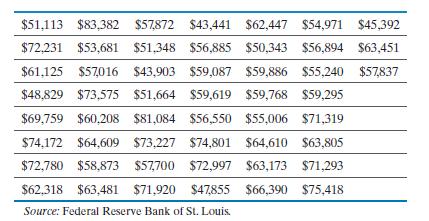
With the first class having a lower class limit of 40,000 and a class width of 5000:
(a) Construct a frequency distribution.
(b) Construct a relative frequency distribution.
(c) Construct a frequency histogram of the data.
(d) Construct a relative frequency histogram of the data.
(e) Describe the shape of the distribution.
(f) Repeat parts (a)–(e) using a class width of 10,000.
(g) Does one frequency distribution provide a better summary of the data than the other? Explain.
Fantastic news! We've Found the answer you've been seeking!
Step by Step Answer:
a b Relative frequency for the median income 4000044...View the full answer

Answered By
Srinivas sai
I am currently pursuing Mechanical Engineering in one of the reputed institutes from india. I always love to share my knowledge with others. Teaching gives me an feeling of satisfaction which i don't expect in any other profession.What's more fun than sharing our knowledge to others while earning some bucks from it!!!
Mathematics lover!!!
Physics Admirer!!
Passionate teacher!!!
0 Reviews
10+ Question Solved
Related Book For 
Statistics Informed Decisions Using Data
ISBN: 9780135780183
6th Edition
Authors: Michael Sullivan III
Question Posted:
