

The table shows the tax, in dollars, on a pack of cigarettes in each of the 50
Question:
The table shows the tax, in dollars, on a pack of cigarettes in each of the 50 states and Washington, DC, as of January 2015.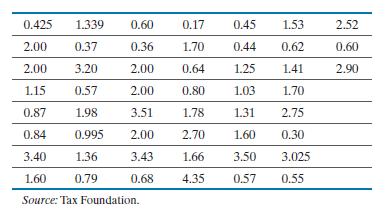
With a first class having a lower class limit of 0 and a class width of 0.50:
(a) Construct a frequency distribution.
(b) Construct a relative frequency distribution.
(c) Construct a frequency histogram of the data.
(d) Construct a relative frequency histogram of the data.
(e) Describe the shape of the distribution.
(f) Repeat parts (a)–(e) using a class width of 1.
(g) Does one frequency distribution provide a better summary of the data than the other? Explain.
Fantastic news! We've Found the answer you've been seeking!
Step by Step Answer:
a b c d e The distribution appears to be right skewed f Relative frequency of 00999 ...View the full answer

Answered By
Parvesh Kumar
I am an experienced Mathematics and Statistics tutor with 10 years of experience teaching students and working professionals. I love teaching students who are passionate to learn subjects or wants to understand any mathematics and statistics concept at graduation or master’s level. I have worked with thousands of students in my teaching career. I have helped students deal with difficult topics and subjects like Calculus, Algebra, Discrete Mathematics, Complex analysis, Graph theory, Hypothesis testing, Probability, Statistical Inference and more. After learning from me, students have found Mathematics and Statistics not dull but a fun subject. I can handle almost all curriculum of mathematics. I did B.Sc (mathematics), M.Sc (mathematics), M.Tech (IT) and am also Gate (CS) qualified. I have worked in various college and school and also provided online tutoring to American and Canadian students. I look forward to discussing with you and make learning a meaningful and purposeful
4+ Reviews
10+ Question Solved
Related Book For 
Statistics Informed Decisions Using Data
ISBN: 9780135780183
6th Edition
Authors: Michael Sullivan III
Question Posted:
