

Fit the model V = CP a to the ``pace of life'' data in Table 4.5. Use
Question:
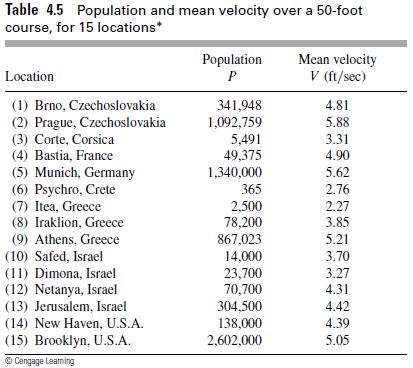
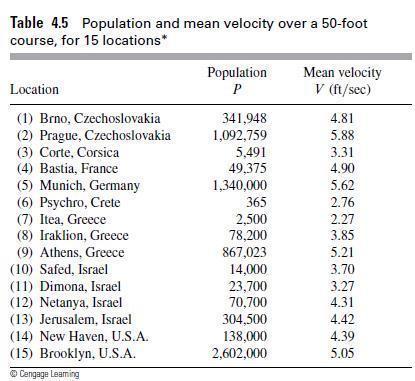
Fit the model V = CPa to the ``pace of life'' data in Table 4.5. Use the transformation log V = a log P + log C. Plot log V versus log P. Does the relationship seem reasonable?
Table 4.5
b. Construct a scatterplot of your log–log data.
e. Find the linear equation that relates log V and log P.
f. Find the equation of the form V = CPa that expresses V in terms of P.
In 1976, Marc and Helen Bornstein studied the pace of life.2 To see if life becomes more hectic as the size of the city becomes larger, they systematically observed the mean time required for pedestrians to walk 50 feet on the main streets of their cities and towns. In Table 4.5, we present some of the data they collected. The variable P represents the population of the town or city, and the variable V represents the mean velocity of pedestrians walking the 50 feet. Problems 1-5 are based on the data in Table 4.5.
Table 4.5
Step by Step Answer:
b e f lo...View the full answer


A First Course In Mathematical Modeling
ISBN: 9781285050904
5th Edition
Authors: Frank R. Giordano, William P. Fox, Steven B. Horton
