

In Example 1, assume that all cars were initially in Orlando. Try several different starting values. Is
Question:
In Example 1, assume that all cars were initially in Orlando. Try several different starting values. Is equilibrium achieved in each case? If so, what is the final distribution of cars in each case?
Data from example 1
Consider a rental car company with branches in Orlando and Tampa. Each rents cars to Florida tourists. The company specializes in catering to travel agencies that want to arrange tourist activities in both Orlando and Tampa. Consequently, a traveler will rent a car in one city and drop off the car in either city. Travelers begin their itinerary in either city. Cars can be returned to either location, which can cause an imbalance in available cars to rent. The following historical data on the percentages of cars rented and returned to these locations have been collected for the previous few years.
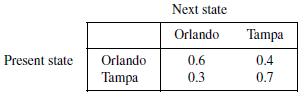
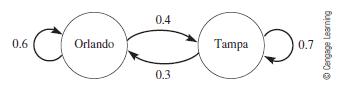
This array of data is called a transition matrix and shows that the probability for returning a car to Orlando that was also rented in Orlando is 0.6, whereas the probability that it will be returned in Tampa is 0.4. Likewise, a car rented in Tampa has a 0.3 likelihood of being returned to Orlando and a 0.7 probability of being returned to Tampa. This represents a Markov process with two states: Orlando and Tampa. Notice that the sum of the probabilities for transitioning from a present state to the next state, which is the sum of the probabilities in each row, equals 1 because all possible outcomes are taken into account. The process is illustrated in Figure 6.2.
Figure 6.2
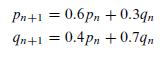
Model Formulation Let's dene the following variables: pn = the percentage of cars available to rent in Orlando at the end of period n qn = the percentage of cars available to rent in Tampa at the end of period n Using the previous data and discrete modeling ideas from Section 1.4, we construct the following probabilistic model:
Model Solution Assuming that all of the cars are originally in Orlando, numerical solutions to System (6.1) give the long-term behavior of the percentages of cars available at each location. The sum of these long-term percentages or probabilities also equals 1. Table 6.1 and Figure 6.3 show the results in table form and graphically Notice that:
Table 6.1
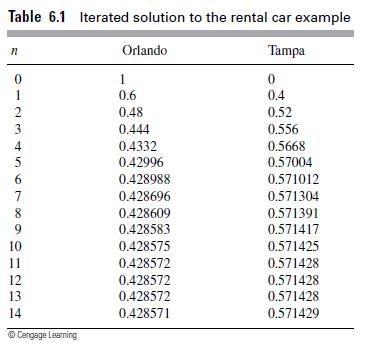
Figure 6.3
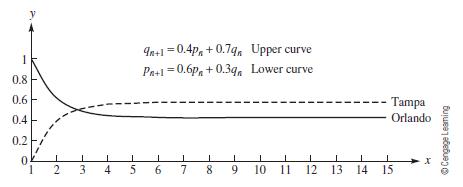
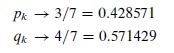
Model Interpretation If the two branches begin the year with a total of n cars, then in the long run, approximately 57% of the cars will be in Tampa and 43% will be in Orlando. Thus, starting with 100 cars in each location, about 114 cars will be based out of Tampa and 86 will be based out of Orlando in the steady state (and it would take only approximately 5 days to reach this state).
Step by Step Answer:


A First Course In Mathematical Modeling
ISBN: 9781285050904
5th Edition
Authors: Frank R. Giordano, William P. Fox, Steven B. Horton
