

In Example 2, it was assumed that initially the voters were equally divided among the three parties.
Question:
In Example 2, it was assumed that initially the voters were equally divided among the three parties. Try several different starting values. Is equilibrium achieved in each case? If so, what is the final distribution of voters in each case?
Data from example 2
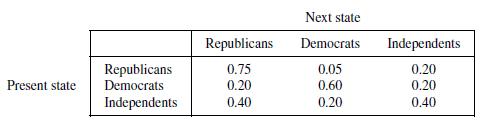
Presidential voting tendencies are of interest every 4 years. During the past decade, the independent party has emerged as a viable alternative for voters in the presidential race. Let's consider a three-party system with Republicans, Democrats, and Independents. Problem Identification Can we find the long-term behavior of voters in a presidential election? Assumptions During the past decade, the trends have been to vote less strictly along party lines. We provide hypothetical historical data for voting trends in the past 10 years of statewide voting. The data are presented in the following hypothetical transition matrix and shown in Figure 6.4.
Figure 6.4
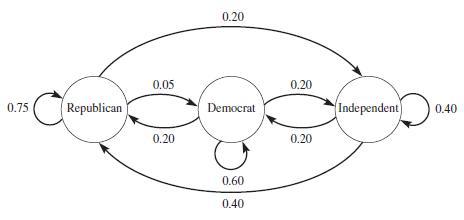
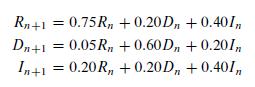
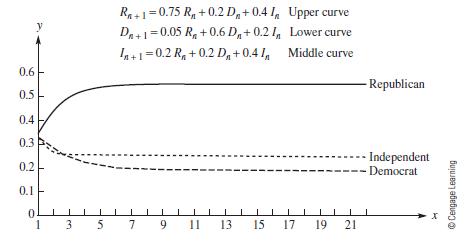
Model Formulation Let's define the following variables: Rn = the percentage of voters to vote Republican in period n Dn = the percentage of voters to vote Democratic in period n In = the percentage of voters to vote Independent in period n Using the previous data and the ideas on discrete dynamical systems from Chapter 1, we can formulate the following system of equations giving the percentage of voters who vote Republican, Democratic, or Independent at each time period.
Model Solution Assume that initially 1/3 of the voters are Republican, 1/3 are Democrats, and 1/3 are Independent. We then obtain the numerical results shown in Table 6.2 for the percentage of voters in each group at each period n. The table shows that in the long run (and after approximately 10 time periods), approximately 56% of the voters cast their ballots for the Republican candidate, 19% vote Democrat, and 25% vote Independent. Figure 6.5 shows these results graphically.
Table 6.2
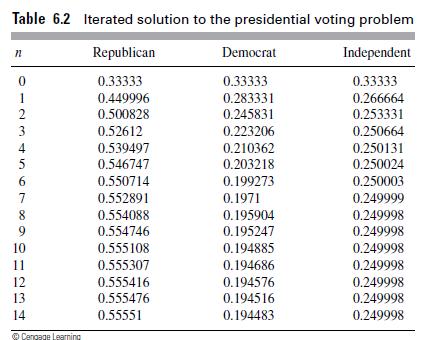
Figure 6.5
Let's summarize the ideas of a Markov chain. A Markov chain is a process consisting of a sequence of events with the following properties:
1. An event has a finite number of outcomes, called states. The process is always in one of these states.
2. At each stage or period of the process, a particular outcome can transition from its present state to any other state or remain in the same state.
3. The probability of going from one state to another in a single stage is represented by a transition matrix for which the entries in each row are between 0 and 1, each row sums to 1. These probabilities depend only on the present state and not on past states.
Step by Step Answer:


A First Course In Mathematical Modeling
ISBN: 9781285050904
5th Edition
Authors: Frank R. Giordano, William P. Fox, Steven B. Horton
