

The following graph shows the percent of U.S. household that had a pet for the years 2015
Question:
The following graph shows the percent of U.S. household that had a pet for the years 2015 and 2017.
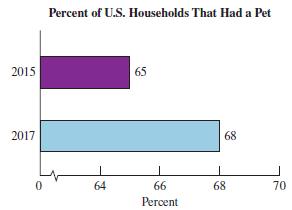
Draw a bar graph that shows the entire scale from 0 to 100 percent.
Fantastic news! We've Found the answer you've been seeking!
Step by Step Answer:
2015 2017 0 P...View the full answer

Answered By
PALASH JHANWAR
I am a Chartered Accountant with AIR 45 in CA - IPCC. I am a Merit Holder ( B.Com ). The following is my educational details.
PLEASE ACCESS MY RESUME FROM THE FOLLOWING LINK: https://drive.google.com/file/d/1hYR1uch-ff6MRC_cDB07K6VqY9kQ3SFL/view?usp=sharing
3+ Reviews
10+ Question Solved
Related Book For 

A Survey Of Mathematics With Applications
ISBN: 9780135740460
11th Edition
Authors: Allen R. Angel, Christine D. Abbott, Dennis Runde
Question Posted:
