

The following graph was created using Stat Crunch with data obtained from AccuWeather.com. The graph indicates the
Question:
The following graph was created using Stat Crunch with data obtained from AccuWeather.com. The graph indicates the hourly temperature, in degrees Fahrenheit, in Dubuque, Iowa, from 9 a.m. to 5 p.m. on Sunday, March 17, 2019. The quadratic function t(x) = -0.59x2 + 4.71x + 44.39 can be used to estimate the hourly temperature, where x is the number of hours since 9 a.m. and 0 ≤ x ≤ 8.
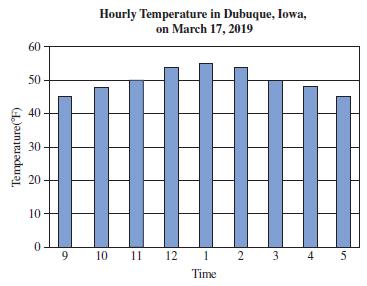
a) Use the function t(x) to estimate the temperature in Dubuque at 12 p.m. Round your answer to the nearest degree.
b) Use the graph to determine the hour that the temperature was a maximum.
c) Determine the x-coordinate of the vertex of the graph of t(x). Then use this value in t(x) to estimate the maximum temperature. Round your value of x to the nearest hour. Round your answer for the temperature to the nearest degree.
Step by Step Answer:
a t3 0593 2 4713 4439 ...View the full answer


A Survey Of Mathematics With Applications
ISBN: 9780135740460
11th Edition
Authors: Allen R. Angel, Christine D. Abbott, Dennis Runde
