

Using the UNH Quarterly Sales data (UnitedHealth Group): a. Create a line chart of sales. Do you
Question:
Using the UNH Quarterly Sales data (UnitedHealth Group):
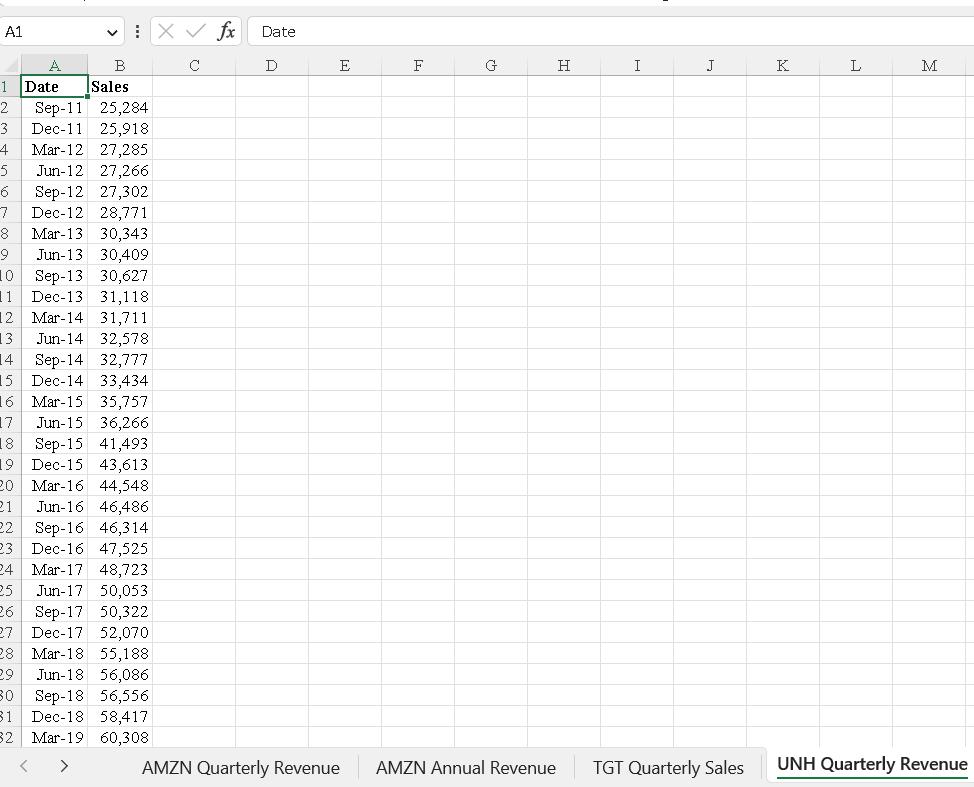
a. Create a line chart of sales. Do you see a trend?
b. Do you see any seasonality? If so, what is the frequency and what quarter typically has the highest sales?
c. Create a forecast for UnitedHealth Group’s sales for June 2019 using the SES model.
d. Create a forecast for UnitedHealth Group’s sales for June 2019 using the LES model.
e. Which of the two models fits the data better based on MSE?
Fantastic news! We've Found the answer you've been seeking!
Step by Step Answer:

Answered By
Sandhya Sharma
I hold M.Sc and M.Phil degrees in mathematics from CCS University, India and also have a MS degree in information management from Asian institute of technology, Bangkok, Thailand. I have worked at a international school in Bangkok as a IT teacher. Presently, I am working from home as a online Math/Statistics tutor. I have more than 10 years of online tutoring experience. My students have always excelled in their studies.
119+ Reviews
214+ Question Solved
Related Book For 

Question Posted:
