

The figure shows a normal distribution with mean m and standard deviation d, including approximate percents of
Question:
The figure shows a normal distribution with mean m and standard deviation d, including approximate percents of the distribution corresponding to the six regions shown.
The mean value of 500 homes in a county is $225,000 and the standard deviation is $25,000.
Approximately how many of the homes in the county are between $175,000 and $225,000?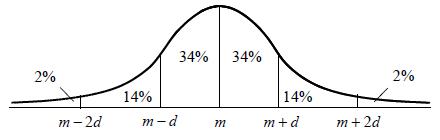
A) 310
B) 340
C) 380
D) 410
Fantastic news! We've Found the answer you've been seeking!
Step by Step Answer:
D 2 m2d 14 34 34 md m 14 md m 2d 2 The mean value of 500 homes in a cou...View the full answer

Answered By
Shaira grace
I have experience of more than ten years in handing academic tasks and assisting students to handle academic challenges. My level of education and expertise allows me communicate eloquently with clients and therefore understanding their nature and solving it successfully.
4+ Reviews
10+ Question Solved
Related Book For 

Question Posted:
