

The figure shows a normal distribution with mean m and standard deviation d, including approximate percentages of
Question:
The figure shows a normal distribution with mean m and standard deviation d, including approximate percentages of the distribution corresponding to the regions shown. Suppose the SAT math scores of 1,200 students entering a certain university are normally distributed with a mean score of 600 and standard deviation of 60.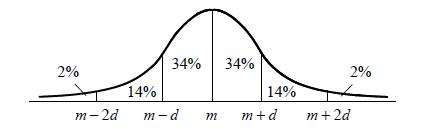 Approximately how many of the students have SAT scores greater than 720?
Fantastic news! We've Found the answer you've been seeking!
Step by Step Answer:
Two percent of th...View the full answer

Answered By
Ashok Kumar Malhotra
Chartered Accountant - Accounting and Management Accounting for 15 years.
QuickBooks Online - Certified ProAdvisor (Advance - QuickBooks Online for 3 years.
3+ Reviews
10+ Question Solved
Related Book For 
Question Posted:
