The graph depicts a survey of 400 senior students in a high school who took the AP
Question:
The graph depicts a survey of 400 senior students in a high school who took the AP tests last May. The number of AP tests taken by each student ranges from zero to six.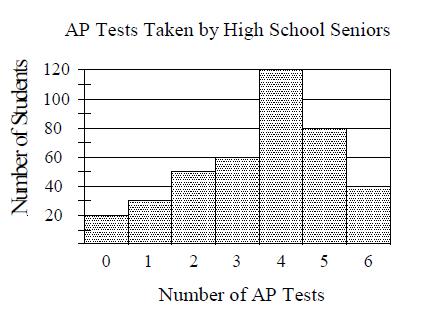
Which of the following is NOT true of the survey results?
A) The mode of the number of AP tests taken by each student was 4.
B) The average (arithmetic mean) number of AP tests taken by the senior students was greater than the median number of AP tests taken by the senior students.
C) The average (arithmetic mean) number of AP tests taken by the senior students was equal to the median number of AP tests taken by the senior students.
D) The average (arithmetic mean) number of AP tests taken by the senior students was less than the median number of AP tests taken by the senior students.
Step by Step Answer:
B The mode of a set of data is the number that appears most frequently Therefore the mode of the ...View the full answer