

The graph depicts a survey of 400 senior students in a high school who took the AP
Question:
The graph depicts a survey of 400 senior students in a high school who took the AP tests last May. The number of AP tests taken by each student ranges from zero to six.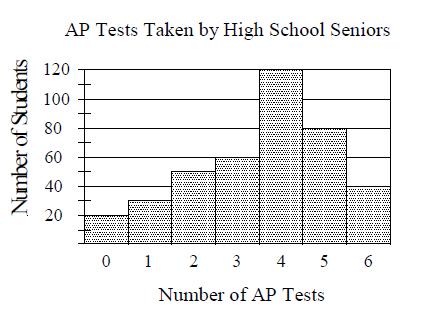
By what percent is the number of senior students who took 4 AP tests greater than the number of senior students who took 3 AP tests?
A) 50%
B) 75%
C) 100%
D) 200%
Fantastic news! We've Found the answer you've been seeking!
Step by Step Answer:
C There are 120 senior students who took 4 AP tests and there are 60 students who took 3 ...View the full answer

Answered By
PALASH JHANWAR
I am a Chartered Accountant with AIR 45 in CA - IPCC. I am a Merit Holder ( B.Com ). The following is my educational details.
PLEASE ACCESS MY RESUME FROM THE FOLLOWING LINK: https://drive.google.com/file/d/1hYR1uch-ff6MRC_cDB07K6VqY9kQ3SFL/view?usp=sharing
3+ Reviews
10+ Question Solved
Related Book For 

Question Posted:
