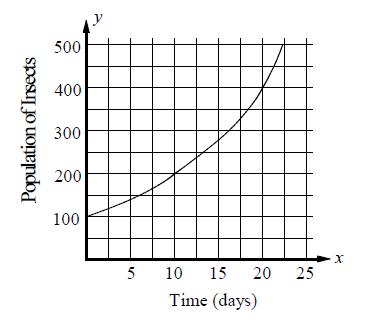
The graph shows the size of a certain insect population over 25 days. The population at time
Question:
The graph shows the size of a certain insect population over 25 days. The population at time t = 0 was 100. A biologist used the equation to model the population.

What is the value of din the equation?
Transcribed Image Text:
Population of Insects 500 400 300 200 100 5 Ap 10 15 20 25 Time (days) X
Fantastic news! We've Found the answer you've been seeking!
Step by Step Answer:
Answer rating: 100% (5 reviews)
ft 1002 a In the equation d represents the amount of time i...View the full answer

Answered By

S Mwaura
A quality-driven writer with special technical skills and vast experience in various disciplines. A plagiarism-free paper and impeccable quality content are what I deliver. Timely delivery and originality are guaranteed. Kindly allow me to do any work for you and I guarantee you an A-worthy paper.
4.80+
27+ Reviews
73+ Question Solved
Related Book For 

Question Posted:
Students also viewed these Mathematics questions
-
The graph shows the size of a certain insect population over 25 days. The population at time t = 0 was 100. A biologist used the equationto model the population. What was the population of the insect...
-
The size of a certain insect population is given by P(t) = 300e 0.01t , where t is measured in days. (a) How many insects were present initially? (b) Give a differential equation satisfied by P(t)....
-
2) Boucher Ltd. (Boucher) sold equipment to Flynn Corporation (Flynn) for $450,000 on January 1, 2021. Flynn paid cash of $75,000 and signed a 7%, $375,000 note payable for the balance. The note...
-
In a perpetual inventory system: (a) LIFO cost of goods sold will be the same as in a periodic inventory system. (b) average costs are a simple average of unit costs incurred. (c) a new average is...
-
Amazon.com announced in a May 19, 2011, news release that the company was selling more Kindle books than traditional print books. From their first sales in November 2007, these ebooks have continued...
-
A contour map of a function is shown. Use it to make a rough sketch of the graph of f . yA -9- 8.
-
What is the expectations gap?
-
Yolanda Hagen, a former disc golf star, operates Yolandas Discorama. At the beginning of the current season on April 1, the ledger of Yolandas Discorama showed Cash $1,800, Inventory $2,500, and...
-
The example may be a sales tax or income tax proposal at any level of government. In your initial post, explain the revenue proposal, and evaluate it for equity, adequacy of revenue generation,...
-
The half-life of a radioactive substance is the amount of time it takes for half of the substance to decay. The table below shows the time (in years) and the amount of substance left for a certain...
-
A house bought ten years ago for $150,000 was sold for $240,000 this year. Which of the following equations can be used to solve the annual growth rate r of the value of the house? (1+1) A)...
-
In addition to being a major online retailer, Amazon.com acts as an e-intermediary for many small to medium-sized businesses. Imagine that you are interested in selling refurbished cell phones. Using...
-
XYZs stock paid $2.00 dividend last year. The companys earnings and dividends are expected to grow at an annual rate of 5%. Given its risk, if the investors required rate of return on the stock is...
-
You are planning to launch your e-commerce business in Canada. B2B or B2C or C2C. Select 1 and why are you choosing it . Who are your main competitor? Competition analysis to be done with respect to...
-
If the applicable discount rate is 2.6%, what is the present value of the following stream of cash flows? Round to the nearest cent. Cash Flow Year 1: $3,000 Cash Flow Year 2: $4,000 Cash Flow Year...
-
The Nurses Union is very happy now that the deadband feature is up and working at KGH. KGH is now looking to see if MedCo can step up their game. They want to be able to have multiple limits on the...
-
Perform the annual journal entries for eHealth under the old and new revenue recognition standard for one Medicare Advantage policy using the information in Exhibit 7. Under the new standard, how...
-
The type of rate law for a reaction, either the differential rate law or the integrated rate law, is usually determined by which data are easiest to collect. Explain.
-
What types of questions can be answered by analyzing financial statements?
-
What is the expected event rate in the treated group? Cardiovascular Disease A secondary prevention trial of lipid lowering is planned in patients with previous myocardial infarction (MI). Patients...
-
If the rates in Problems 10.42 and 10.43 are the true rates, how many participants will be needed in each group if a one-sided test with = .05 is to be used and an 80% chance of finding a...
-
Are frequencies of reporting of adverse events or negligence comparable in review process A (the original review) and review process B (the re-review)? Health Services Administration In the Harvard...
-
Using legal rules of zambia ,critically examine why it is vital to identify and priotise the objectives of the competition and consumer protection act 2010 of zambia
-
List the stages of federalism, and explain the interaction between the federal government and state governments. You should Include historical events and presidents who helped drive this development.
-
3. The adjacency list of a graph is given below. Draw its adjacency matrix. A->B->D->F B->E C->A->G D->B->F E->D->G F->C G->D

Study smarter with the SolutionInn App


