

The following table lists the newspaper revenue, in billions of dollars, from classified ads for selected years
Question:
The following table lists the newspaper revenue, in billions of dollars, from classified ads for selected years from 1975 to 2013.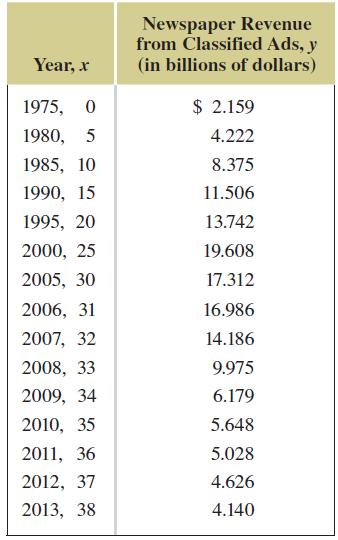
a) Use a graphing calculator to fit cubic and quartic functions to the data. Let x represent the number of years after 1975. Using R2-values, determine which function is the better fit.
b) Using the function found in part (a), estimate the newspaper revenue from classified ads in 1988 and in 2002.
Fantastic news! We've Found the answer you've been seeking!
Step by Step Answer:
ANSWER a Using a graphing calculator we can plot the data points and use the Regression feature to f...View the full answer

Answered By
Akash M Rathod
I have been utilized by educators and students alike to provide individualized assistance with everything from grammar and vocabulary to complex problem-solving in various academic subjects. I can provide explanations, examples, and practice exercises tailored to each student's individual needs, helping them to grasp difficult concepts and improve their skills.
My tutoring sessions are interactive and engaging, utilizing a variety of tools and resources to keep learners motivated and focused. Whether a student needs help with homework, test preparation, or simply wants to improve their skills in a particular subject area, I am equipped to provide the support and guidance they need to succeed.
0 Reviews
10+ Question Solved
Related Book For 

Algebra And Trigonometry Graphs And Models
ISBN: 9780134179049
6th Edition
Authors: Marvin Bittinger, Judith Beecher, David Ellenbogen, Judith Penna
Question Posted:
