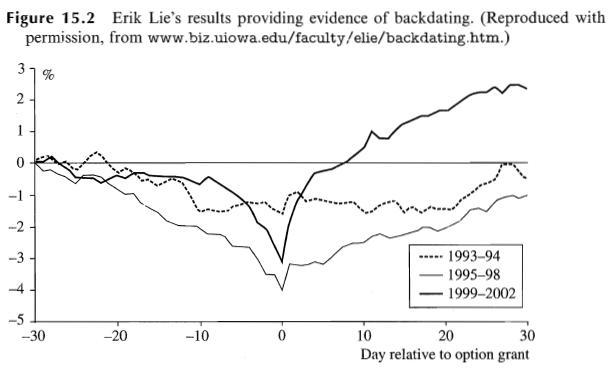
Explain how you would do the analysis to produce a chart such as the one in Figure
Question:
Explain how you would do the analysis to produce a chart such as the one in Figure 15.2.

Transcribed Image Text:
Figure 15.2 Erik Lie's results providing evidence of backdating. (Reproduced with permission, from www.biz.uiowa.edu/faculty/elie/backdating.htm.) 3 2 1 7 -2 -3- -4 -5 % -30 -20 -10 www. 1993-94 1995-98 1999-2002 10 20 30 Day relative to option grant
Fantastic news! We've Found the answer you've been seeking!
Step by Step Answer:
Answer rating: 0% (1 review)

Answered By

Muhammad Umair
I have done job as Embedded System Engineer for just four months but after it i have decided to open my own lab and to work on projects that i can launch my own product in market. I work on different softwares like Proteus, Mikroc to program Embedded Systems. My basic work is on Embedded Systems. I have skills in Autocad, Proteus, C++, C programming and i love to share these skills to other to enhance my knowledge too.
3.50+
1+ Reviews
10+ Question Solved
Related Book For 

Question Posted:
Students also viewed these Business questions
-
Explain how you would do the analysis to produce a chart.
-
The new line character is utilized solely as the last person in each message. On association with the server, a client can possibly (I) question the situation with a client by sending the client's...
-
Developments in Technology Light is incident from air on the end face of a multimode optical fibre at angle of incidence as shown below. n n 1 2 The refractive indices of the core and cladding are...
-
Evaluate each expression if possible. (-3)4
-
A just-in-time inventory system reduces the cost of ordering additional inventory by a factor of 100. What is the change in the optimal order size predicted by the economic order quantity model?
-
Your firm is the auditor of Trojan Trading Ltd. The audited financial statements for the year ended December 31, 2023, show the companys revenue was $5 million and the profit before tax was $320,000....
-
A company is considering two alternatives, one of which must be implemented. Of the two projects, A has the higher maintenance cost, but B has the higher investment cost. The appropriate (and...
-
Go back to the numerical example with no factor substitution that leads to the production possibility frontier in Figure a. What is the range for the relative price of cloth such that the economy...
-
Pioneer Inc. wants to invest $557,302 today. The expected returns in years 1, 2, and 3 are $247,615, $180,383, and $335,481, respectively. If the rate of return on investment must be at least 14%,...
-
Mike Curtains, a Registered Tax Agent, attends to the tax affairs of Frodo West. In preparing Frodo's 2021/22 income tax return, the following occurred: Frodo attended a meeting with Mike in August...
-
A company has granted \(1,000,000\) options to its employees. The stock price and strike price are both \(\$ 20\). The options last 10 years and vest after 3 years. The stock price volatility is \(30...
-
Show that \(S^{-2 r / \sigma^{2}}\) could be the price of a traded derivative security.
-
A publisher decides to use one section of its plant to produce two textbooks called Microeconomics and Macroeconomics. The profit made on each copy is $12 for Microeconomics and $18 for...
-
Which of the following is not an example of a product line length? a. Diet Coke, Cherry Coke, and Classic Coke b. Quaker Instant Oatmeal, Quaker Oatmeal Squares, and Quaker Toasted Oats c. Honda...
-
Which of the following is a consumer sales promotion tool? a. A 10-percent-off online promo code b. A $10.00 mail-in rebate c. A frequent buyer card d. All of the above
-
Which firm looks best for someone planning to pay cash to buy 100 shares?
-
Which of the following does not define a B2B market? a. The market consists of small-volume purchases in a geographically dispersed area. b. Buyers make complex purchasing decisions, often with...
-
Citizen A in a country earns $130,000 and pays $12,000 in taxes. Citizen B earns $55,000 and pays $10,000 in taxes. Explain whether the tax structure is progressive or regressive. (HL only)
-
In an experiment on standing waves, a string 90 cm long is attached to the prong of an electrically driven tuning fork that oscillates perpendicular to the length of the string at a frequency of 60...
-
Given find the value of k. es 1 e kx dx = 1 4'
-
Explain the historical simulation method for calculating VaR.
-
Explain the problem in using Monte Carlo simulation to value an American option.
-
The probability for an up-movement on a binomial tree is (a d)/(u d). Explain how the growth factor a is calculated for (a) a non-dividend-paying stock, (b) a stock index, (c) a foreign currency,...
-
Macho Taco sold a food truck on March 1, 2017. The accounts showed adjusted balances on February 28, 2017, as follows: Food Truck $ 61,000 Accumulated Depreciation, Food Truck 37,050 Required: Record...
-
write a brief memo to a project sponsor, describing where in the project management process group would a project team be formed and share insights on when, within your team will you use the three...
-
Evans Company had total sales of $3,800,000 for fiscal 20x5. The costs of quality-related activities are given below. Returns/allowances $190,000 Design changes 228,000 Prototype inspection 11,400...

Study smarter with the SolutionInn App


