

The Corporate Average Fuel Economy (CAFE) regulations were put into law by Congress in 1975 to promote
Question:
In order to meet CAFE constraints while maximizing profits, General Motors (GM) has used mathematical models to coordinate their pricing and production decisions. The objective function in this model is nonlinear, similar to the Par, Inc., model that we developed in this chapter. In this case we build a model similar to the one built for General Motors. The CAFE requirement on fleet miles per gallon is based on an average. The harmonic average is used to calculate the CAFE requirement on average miles per gallon.
In order to understand the harmonic average, assume that there is a passenger car and a light truck. The passenger car gets 30 miles per gallon (MPG) and the light truck gets 20 MPG. Assume each vehicle is driven exactly one mile. Then the passenger car consumes 1/30 gallon of gasoline in driving one mile and the light truck consumes 1/20 gallon of gasoline in driving one mile. The amount of gasoline consumed in total is Gas consumption = (1/30) + (1/20) = (5/60) = (1/12) gallon The average MPG of the two vehicles calculated the €œnormal way€ is (30 + 20)/2 = 25 MPG. If both vehicles are €œaverage,€ and each vehicle is driven exactly one mile, then the total gasoline consumption is Gas consumption = (1/25) + (1/25) = (2/25) gallon Because (2/25) is not equal to (5/60), the total gas consumption of two €œaverage vehicles€ driving exactly one mile is not equal to the total gas consumption of each of the original vehicles driving exactly one mile. This is unfortunate. In order to make it easy for the government to impose and enforce MPG constraints on the auto companies, it would be nice to have
a single target value MPG that every company in the auto industry must meet. As just illustrated, there is a problem with requiring an average MPG on the industry because it will incorrectly estimate the gas mileage consumption of the fleet. Fortunately, there is a statistic called the harmonic average so that total gas consumption by harmonic average vehicles is equal to gas consumption of the actual vehicles.
For simplicity, first assume that there are two types of vehicles in the fleet, passenger cars and light trucks. If there is one passenger car getting 30 MPG and there is one light truck getting 20 MPG, the harmonic average of these two vehicles is
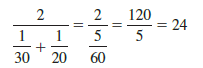
If each vehicle were to drive exactly one mile, each vehicle would consume 1/24 gallon of gasoline for a total of 2/24 = 1/12 gallon of gasoline. In this case each €œaverage€ vehicle driving exactly one mile results in total gas consumption equal to the total gas consumption of each vehicle with a different MPG rating driving exactly one mile. If there are three passenger vehicles and two light trucks, the harmonic average is given by
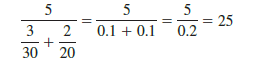
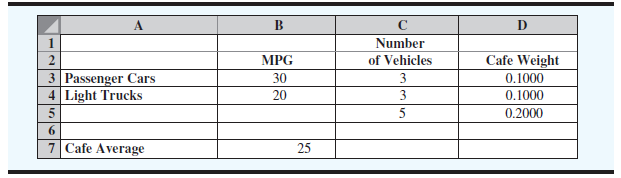
In general, when calculating the harmonic average, the numerator is the total number of vehicles. The denominator is the sum of two terms. Each term is the ratio of the number of vehicles in that class to the MPG of cars in that class. For example, the first ratio in the denominator is 3/30 because there are 3 cars (the numerator) each getting 30 MPG (the denominator). These calculations are illustrated in Figure 8.17. Based on Figure 8.17, if each of the 5 cars is average and drives exactly one mile, (5/25) = (1/5) gallon of gas is consumed. If three cars getting 30 MPG drive exactly one mile each and two cars getting 20 MPG drive exactly one mile, then (3/30) + (2/20) = (2/10) = (1/5) gallon is consumed. Thus, the average cars exactly duplicate the gas consumption of the fleet with varying MPG. Now assume that the demand function for passenger cars is Demand = 750 - PC
where PC is the price of a passenger car. Similarly, the demand function for light trucks is Demand = 830 - PT where PT is the price of a light truck.
Managerial Report
1. Using the formulas given in equations (8.24) and (8.25), develop an expression for the total profit contribution as a function of the price of cars and the price of light trucks.
2. Using Excel Solver or LINGO, find the price for each car so that the total profit contribution is maximized.
3. Given the prices determined above, calculate the number of passenger cars sold and the number of light trucks sold.
4. Duplicate the spreadsheet in Figure 8.17. Your spreadsheet should have formulas in cells D3:D5 and B7 and be able to calculate the harmonic (CAFE) average for any MPG rating and any number of vehicles in each category.
5. Again, assume that passenger cars get 30 MPG and light trucks get 20 MPG; calculate the CAFE average for the fleet size from part (3).
6. If you do the calculation in part (5) correctly, the CAFE average of the fleet is 23.57. Add a constraint that the fleet average must be 25 MPG and re-solve the model to get the maximum total profit contribution subject to meeting the CAFE constraint.
Step by Step Answer:
1 The model is PASSENGR CAR MILES PER GALLON PASSMPG 30 LIGHT TRUCK MILES PER GALLON LTRUCKMPG 20 PP ...View the full answer


An Introduction to Management Science Quantitative Approach to Decision Making
ISBN: 978-1337406529
15th edition
Authors: David R. Anderson, Dennis J. Sweeney, Thomas A. Williams, Jeffrey D. Camm, James J. Cochran
