

When the Georgia Department of Transportation (GDOT) wanted to optimize the use of Big Data and advanced
Question:
When the Georgia Department of Transportation (GDOT) wanted to optimize the use of Big Data and advanced analytics to gain insight into transportation, it worked with Teradata to develop a proof of concept evaluation of GDOT's variable speed limit (VSL) pilot project.
The VSL concept has been adopted in many parts of the world, but it is still relatively new in the United States. As GDOT explains, VSL are speed limits that change based on road, traffic, and weather conditions. Electronic signs slow down traffic ahead of congestion or bad weather to smooth out flow, diminish stop-andgo conditions, and reduce crashes. This lowcost, cutting edge technology alerts drivers in real time to speed changes due to conditions down the road. More consistent speeds improve safety by helping to prevent rear-end and lane changing collisions due to sudden stops.
Quantifying the customer service, safety, and efficiency benefits of VSL is extremely important to GDOT. This fits within a wider need to understand the effects of investments in intelligent transportation systems as well as other transportation systems and infrastructures.
VSL Pilot Project on I-285 in Atlanta
GDOT conducted a VSL pilot project on the northern half, or "top end," of I-285 that encircles Atlanta.
This 36-mile stretch of highway was equipped with 88 electronic speed limit signs that adjusted speed limits in 10 mph increments from 65 miles per hour (mph) to the minimum of 35 mph. The objectives were twofold:
1. Analyze speeds on the highway before versus after implementation of VSL.
2. Measure the impact of VSL on driving conditions.
To obtain an initial view of the traffic, the Teradata data science solution identified the locations and durations of "persistent slowdowns." If highway speeds are above "reference speed," then traffic is considered freely flowing. Falling below the reference speed at any point on the highway is considered a slowdown. When slowdowns persist across multiple consecutive minutes, a persistent slowdown can be defined.
By creating an analytic definition of slowdowns, it is possible to convert voluminous and highly variable speed data into patterns to support closer investigation. The early analyses of the data revealed that the clockwise and counterclockwise directions of the same highway may show significantly different frequency and duration of slowdowns.
To better understand how slowdowns affect highway traffic, it is useful to take our new definition and zoom in on a specific situation. Figure 6.19 shows a specific but typical Atlanta afternoon on I-285, at a section of highway where traffic is moving clockwise, from west to east, between mile markers MM10 in the west to the east end at MM46.
The first significant slowdown occurred at 3:00 p.m. near MM32. The size of the circles represents duration (measured in minutes). The slowdown at MM32 was nearly four hours long. As the slowdown
"persisted," traffic speed diminished behind it.
The slowdown formed on MM32 became a bottleneck that caused traffic behind it to slow down as well. The "comet trail" of backed-up traffic at the top left of Figure 6.20 illustrates the sequential formation of slowdowns at MM32 and then farther west, each starting later in the afternoon and not lasting as long.
Measuring Highway Speed Variability
The patterns of slowdowns on the highway as well as their different timings and locations led us to question their impact on drivers. If VSL could help drivers better anticipate the stop-and-go nature of the slowdowns, then being able to quantify the impact would be of interest to GDOT. GDOT was particularly concerned about what happens when a driver first encounters a slowdown. "While we do not know what causes the slowdown, we do know that drivers have made speed adjustments. If the slowdown was caused by an accident, then the speed reduction could be quite sudden; alternatively, if the slowdown was just caused by growing volumes of traffic, then the speed reduction might be much more gradual."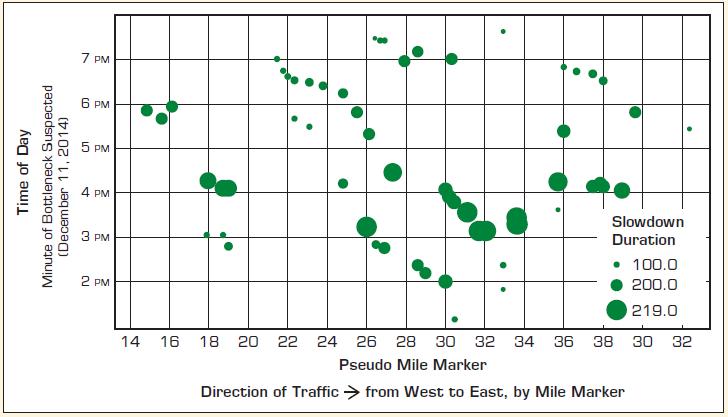
A bottleneck starts as a slowdown at a particular location. Something like a "pinch point" occurs on the highway. Then, over a period of time, traffic slows down behind the original pinch point. A bottleneck is a length of highway where traffic falls below 60 percent of reverence speed and can stay at that level for miles. Figure 6.20 shows a conceptual representation of a bottleneck.
Questions for Case 6.5
1. What was the nature of the problems that GDOT was trying to solve with data science?
2. What type of data do you think was used for the analytics?
3. What were the data science metrics developed in this pilot project? Can you think of other metrics that can be used in this context?
Step by Step Answer:
The nature of the problems that GDOT Georgia Department of Transportation was trying to solve with data science included a Optimizing Variable Speed Limits VSL GDOT wanted to implement and optimize th...View the full answer


Analytics Data Science And Artificial Intelligence Systems For Decision Support
ISBN: 9781292341552
11th Global Edition
Authors: Ramesh Sharda, Dursun Delen, Efraim Turban
