

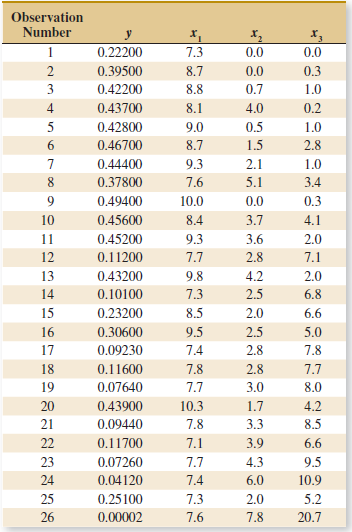
An article in the Journal of Pharmaceuticals Sciences (1991, Vol. 80, pp. 971977) presented data on the
Question:
(a) Construct a matrix of scatter plots for these variables.
(b) Comment on the apparent relationships among y and the other three variables?
Table 6E.8
Fantastic news! We've Found the answer you've been seeking!
Step by Step Answer:
a b Values for y tend to increase as val...View the full answer

Answered By
Aditya Mali
From my childhood I love Mathematics. And now I am taking my degree in mathematics. I am also taking some private classes not only for high school students but also for some graduate students also. I have 2 years of teaching experience. I always love to teach Mathematics. There are some techniques that should know you before the start studying mathematics. At so many times student get confused about the parts of mathematics, I know maths is a difficult subject but when u take interest in it, it's one of the best subject in the world. Your interest is much more important for studying maths. But now don't worry I will be there for you. I will teach maths as part of your life....
0 Reviews
10+ Question Solved
Related Book For 

Applied Statistics And Probability For Engineers
ISBN: 9781118539712
6th Edition
Authors: Douglas C. Montgomery, George C. Runger
Question Posted:
