

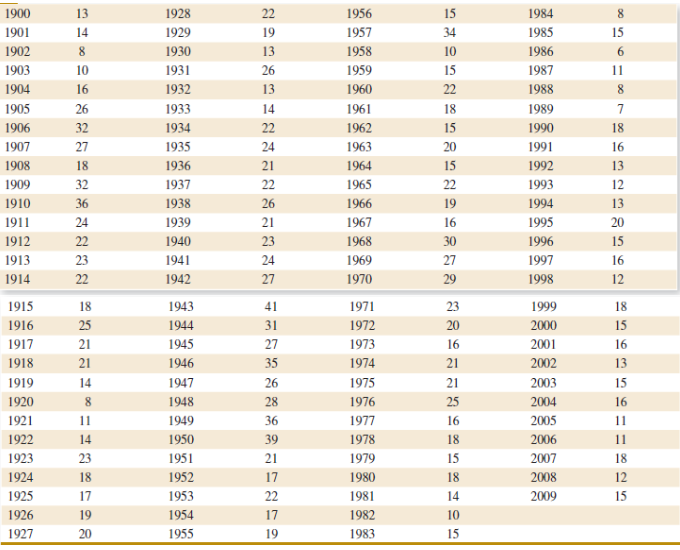
Table 6E.3 shows the number of earthquakes per year of magnitude 7.0 and higher since 1900 (source:
Question:
Table 6E.3
Fantastic news! We've Found the answer you've been seeking!
Step by Step Answer:
Stemandleaf of Number of Earthquakes N 110 Leaf Unit 10 Tim...View the full answer

Answered By
John Aketch
I am a dedicated person with high degree of professionalism, particularly in academic writing. My desire is to is to make students excel in their academic endeavor.
3+ Reviews
10+ Question Solved
Related Book For 

Applied Statistics And Probability For Engineers
ISBN: 9781118539712
6th Edition
Authors: Douglas C. Montgomery, George C. Runger
Question Posted:
