

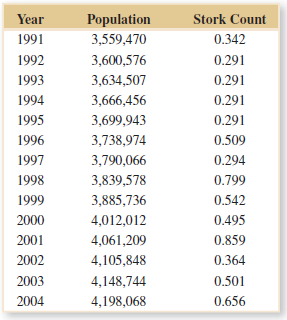
Table E11-21 shows the population and the average count of wood storks sighted per sample period for
Question:
TABLE ˆ™ E11-20 Diamond Price Data
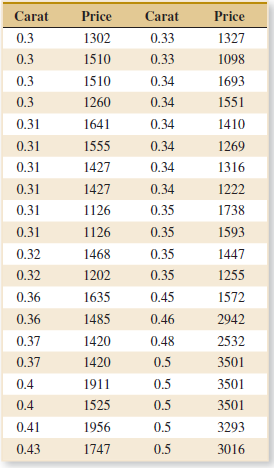
TABLE ˆ™ E11-21 Stork Population Data
Fantastic news! We've Found the answer you've been seeking!
Step by Step Answer:
The regression equation is y 3549143 651828x Yes the regression is significant at ...View the full answer

Answered By
Zablon Gicharu
I am an educator who possesses the requisite skills and knowledge due to interacting with students for an extended period. I provide solutions to various problems in step-by-step explanations, a well-thought approach and an understandable breakdown. My goal is to impart more straightforward methodologies and understanding to students for more remarkable achievements.
4+ Reviews
10+ Question Solved
Related Book For 

Applied Statistics And Probability For Engineers
ISBN: 9781118539712
6th Edition
Authors: Douglas C. Montgomery, George C. Runger
Question Posted:
