Consider the prediction of months classed as economic recession (left(y_{t}=1 ight)) as against growth (left(y_{t}=0 ight)) for
Question:
Consider the prediction of months classed as economic recession \(\left(y_{t}=1\right)\) as against growth \(\left(y_{t}=0\right)\) for the US (the data are contained in the file Exercise 6.6. odc) for the 657 months between April 1953 and December 2007 (Nyberg, 2008). Relevant predictors are S\&P500 stock market returns \(r_{t}\) (percent differences between successive months) and term spread, \(s p_{t}\), namely long-term minus short-term interest rates.
Consider a probit regression with \[\begin{aligned}
y_{t} & \sim \operatorname{Bern}\left(\pi_{t}\right), \\
\pi_{t} & =\Phi\left(\eta_{t}\right) .
\end{aligned}\]
Compare the fit and predictions (within sample and out-of-sample) of two models:
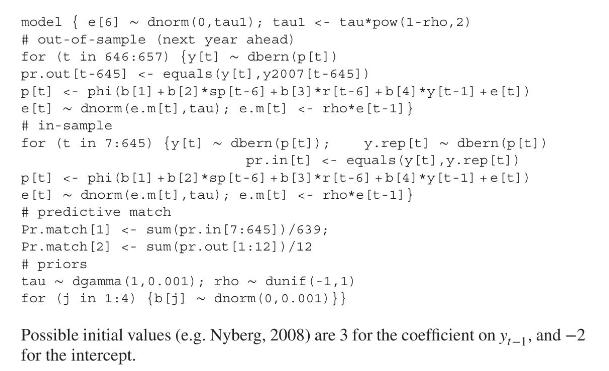
(a) the first uses predictors \(r_{t-6}\) and \(\mathrm{sp}_{t-6}\) (i.e. six month lags in returns and term spread), a one month lag in the response (i.e. \(y_{t-1}\) ), and a stationary AR1 normal error \[\begin{aligned}
& \eta_{t}=\beta_{0}+\beta_{1} r_{t-6}+\beta_{2} \mathrm{sp}_{t-6}+\beta_{3} y_{t-1}+e_{t}, \quad t=7, \ldots, 645 \\
& e_{t} \sim N\left(ho e_{t-1}, 1 / \tau_{\mathrm{e}}\right),-1
(b) a model with predictors \(r_{t-6}\) and \(\mathrm{sp}_{t-6}\), and one month lags in both the response (i.e. \(y_{t-1}\) ) and the predicted probability, but no error, namely \[\eta_{t}=\beta_{0}+\beta_{1} r_{t-6}+\beta_{2} \mathrm{sp}_{t-6}+\beta_{3} y_{t-1}+\beta_{4} \pi_{t-1} .\]
This model involves setting a prior for \(\pi_{6}\). In sample predictions can be made by sampling predictive replicates \(y_{\text {rep }, t} \sim \operatorname{Bern}\left(\pi_{t}\right)\), checking whether \(y_{t}\) and \(y_{\text {rep }, t}\) are the same and then measuring the overall match (combining sensitivity and specificity). Out-of-sample predictions can be compared with the actual observed 12 points for the year \(2007(t=646, \ldots, 657)\). For the first model a possible code (note that \(y\) values are only taken as known up to \(t=645\), namely the end of 2006) is
Data from Example 6.6
Step by Step Answer: