

Lets filter the data by customer. Make a copy of the data worksheet. Name the new worksheet
Question:
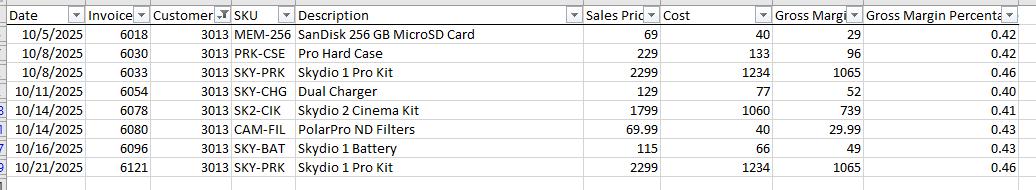
Let’s filter the data by customer. Make a copy of the data worksheet. Name the new worksheet tab Filter. Create a filter for customer number 3013. Copy the resulting data into row 235 (so you can create descriptive statistics). On the same worksheet, create descriptive statistics for customer 3013, placing the descriptive statistics in row 252. Answer the following questions about customer 3013.
a. How many items did customer 3013 buy?
b. Did customer 3013 buy more than one item in a sales transaction?
c. What was the average gross margin percentage for customer 3013’s sales transactions?
d. Create a visualization showing the number of each product purchased by customer 3013 during October. Is the chart a histogram or a bar chart? Explain your answer.
e. Why would management want to analyze sales by individual customers?
Filtered Data
Step by Step Answer:
a n 8 b No Since an invoice number does not appear more than once each transaction was for one item ...View the full answer


Introduction To Business Analytics
ISBN: 9781265454340
1st Edition
Authors: Vernon Richardson, Marcia Watson
