

During 2011 a company implemented a number of policies aimed at reducing the ages of its customers
Question:
During 2011 a company implemented a number of policies aimed at reducing the ages of its customers’ accounts. In order to assess the effectiveness of these measures, the company randomly selects 10 customer accounts. The average age of each account is determined for the years 2010 and 2011. These data are given in Table 10.4. Assuming that the population of paired differences between the average ages in 2011 and 2010 is normally distributed:
Data from Table 10.4
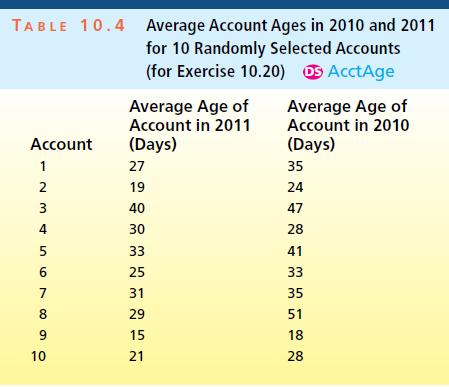
a. Set up the null and alternative hypotheses needed to establish that the mean average account age has been reduced by the company’s new policies.
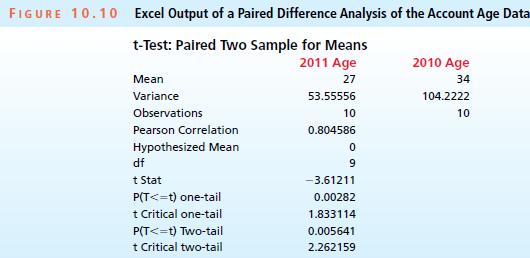
b. Gives the Excel output needed to test the hypotheses of part a. Use critical values to test these hypotheses by setting a equal to .10, .05, .01, and .001. How much evidence is there that the mean average account age has been reduced?
c. Figure 10.10 gives the p-value for testing the hypotheses of part a. Use the p-value to test these hypotheses by setting a equal to .10, .05, .01, and .001. How much evidence is there that the mean average account age has been reduced?
d. Calculate a 95 percent confidence interval for the mean difference in the average account ages between 2011 and 2010. Estimate the minimum reduction in the mean average account ages from Figure 10.10.
Step by Step Answer:
a b t 361 and t01 2821 and t0...View the full answer


Business Statistics In Practice
ISBN: 9780077534844
7th Edition
Authors: Bruce Bowerman, Richard OConnell, Emilly Murphree
