

Figure 2.4 on page 57 shows a bar chart and a pie chart for what devices millennials
Question:
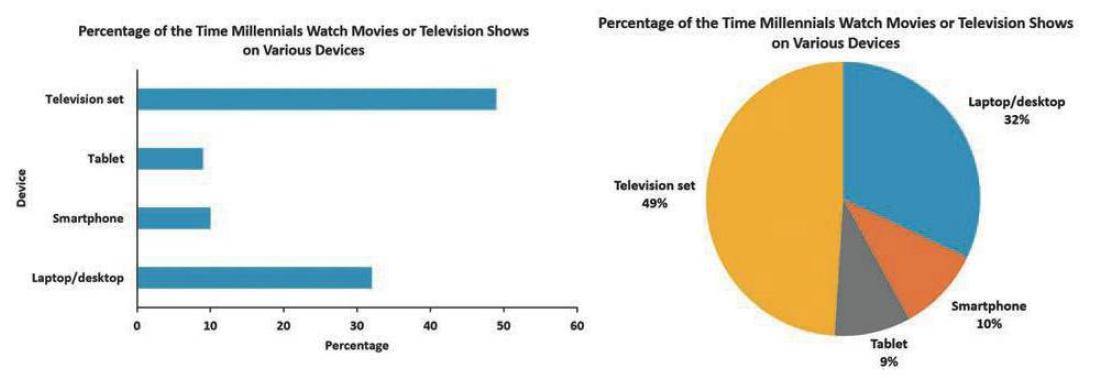
Figure 2.4 on page 57 shows a bar chart and a pie chart for what devices millennials used to watch movies/TV shows.
a. Create an exploded pie chart, a cone chart, or a pyramid chart that shows how people paid for purchases and other transactions.
b. Which graphs either seen in Figure 2.4 or created in (a), do you prefer? Explain.
FIGURE 2.4
Fantastic news! We've Found the answer you've been seeking!
Step by Step Answer:
a b The bar chart and the pie chart should be preferred ...View the full answer

Answered By
Bhartendu Goyal
Professional, Experienced, and Expert tutor who will provide speedy and to-the-point solutions. I have been teaching students for 5 years now in different subjects and it's truly been one of the most rewarding experiences of my life. I have also done one-to-one tutoring with 100+ students and help them achieve great subject knowledge. I have expertise in computer subjects like C++, C, Java, and Python programming and other computer Science related fields. Many of my student's parents message me that your lessons improved their children's grades and this is the best only thing you want as a tea...
2+ Reviews
10+ Question Solved
Related Book For 

Business Statistics A First Course
ISBN: 9780135177785
8th Edition
Authors: David M. Levine, Kathryn A. Szabat, David F. Stephan
Question Posted:
