

Figures 2.5 and 2.6 on pages 58 and 59, show a bar chart and a pie chart
Question:
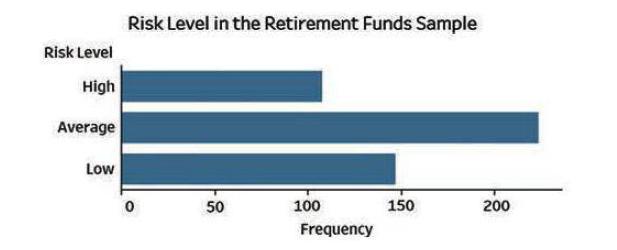
Figures 2.5 and 2.6 on pages 58 and 59, show a bar chart and a pie chart for the risk level for the retirement fund data.
a. Create an exploded pie chart, a doughnut chart, a cone chart, and a pyramid chart that show the risk level of retirement funds.
b. Which graphs, either seen in Figures 2.5 and 2.6 or created in (a), do you prefer? Explain.
FIGURE 2.5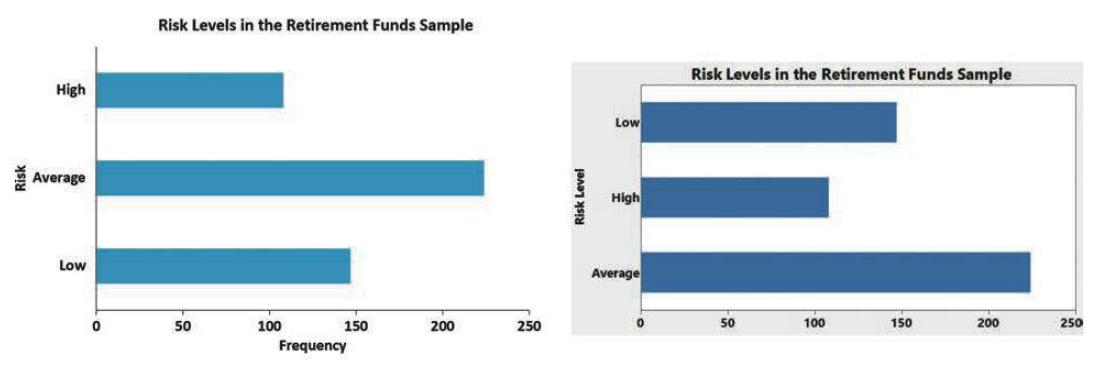
Fantastic news! We've Found the answer you've been seeking!
Step by Step Answer:
a b The bar chart and the pie chart should be pref...View the full answer

Answered By
Fahmin Arakkal
Tutoring and Contributing expert question and answers to teachers and students.
Primarily oversees the Heat and Mass Transfer contents presented on websites and blogs.
Responsible for Creating, Editing, Updating all contents related Chemical Engineering in
latex language
8+ Reviews
22+ Question Solved
Related Book For 
Business Statistics A First Course
ISBN: 9780135177785
8th Edition
Authors: David M. Levine, Kathryn A. Szabat, David F. Stephan
Question Posted:
