

The following table indicates the percentage of residential electricity consumption in the United States, in a recent
Question:
The following table indicates the percentage of residential electricity consumption in the United States, in a recent year organized by type of use.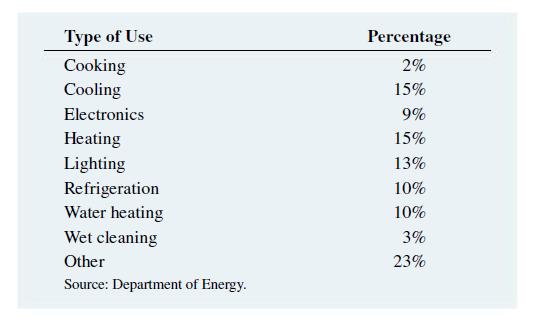
a. Construct a bar chart, a pie chart, and a Pareto chart.
b. Which graphical method do you think is best suited for portraying the table data?
c. What conclusions can you reach concerning residential electricity consumption in the United States?
Fantastic news! We've Found the answer you've been seeking!
Step by Step Answer:
a b The Pareto diagram is better than the pie chart and bar chart because it not only sor...View the full answer

Answered By
Gilbert Chesire
I am a diligent writer who understands the writing conventions used in the industry and with the expertise to produce high quality papers at all times. I love to write plagiarism free work with which the grammar flows perfectly. I write both academics and articles with a lot of enthusiasm. I am always determined to put the interests of my customers before mine so as to build a cohesive environment where we can benefit from each other. I value all my clients and I pay them back by delivering the quality of work they yearn to get.
14+ Reviews
49+ Question Solved
Related Book For 

Business Statistics A First Course
ISBN: 9780135177785
8th Edition
Authors: David M. Levine, Kathryn A. Szabat, David F. Stephan
Question Posted:
